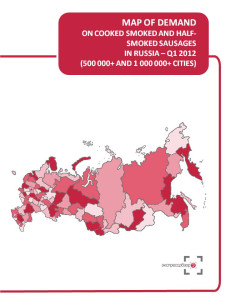


For your convenience we selected regions (subjects of RF) where located cities with population over 500 thousand residents. Map of demand is based on the statistics of these regions. Map of demand on cooked smoked and half-smoked sausages displays expenditures per capita on purchased cooked smoked and half-smoked sausages in rubles, $, € and market volume in rub/$/€/ in Q1 2012.
Maps of demand by ‘Express-Obzor’ consist of 18 main slides (2 slides per each of 9 regional groups):
Map of demand on cooked smoked and half-smoked sausages in Russia
Map of demand on cooked smoked and half-smoked sausages in Central FD (regions where located cities with population over 500 thousand residents)
Map of demand on cooked smoked and half-smoked sausages in Northwest FD (regions where located cities with population over 500 thousand residents)
Map of demand on cooked smoked and half-smoked sausages in Volga FD (regions where located cities with population over 500 thousand residents)
Map of demand on cooked smoked and half-smoked sausages in Southern FD (regions where located cities with population over 500 thousand residents)
Map of demand on cooked smoked and half-smoked sausages in North Caucasus FD (regions where located cities with population over 500 thousand residents)
Map of demand on cooked smoked and half-smoked sausages in Urals FD (regions where located cities with population over 500 thousand residents)
Map of demand on cooked smoked and half-smoked sausages in Siberian FD (regions where located cities with population over 500 thousand residents)
Map of demand on cooked smoked and half-smoked sausages in Far East FD (regions where located cities with population over 500 thousand residents)
About the company
Company Express-Obzor –since 2005 has been specializing in ready-made analytical market reports. Reports made my Express-Obzor’s specialists give an opportunity to receive basic information and a general idea of a market situation in a concise way. All assessments obtained in the course of a research are independent and impartial.
Over the past 7 years of activity the company:
MAP OF DEMAND ON COOKED SMOKED AND HALF-SMOKED SAUSAGES RUSSIA, Q1 2012
Map of demand in Russia
Consumer expenditures, $/€/RUB per capita
Market Volume, $/€/RUB.
Map of demand in Central FD (regions where located cities with population over 500 thousand residents)
Consumer expenditures, $/€/RUB per capita
Market Volume, $/€/RUB.
Map of demand in Northwest FD (regions where located cities with population over 500 thousand residents)
Consumer expenditures, $/€/RUB per capita
Market Volume, $/€/RUB.
Map of demand in Volga FD (regions where located cities with population over 500 thousand residents)
Consumer expenditures, $/€/RUB per capita
Market Volume, $/€/RUB.
Map of demand in Southern FD (regions where located cities with population over 500 thousand residents)
Consumer expenditures, $/€/RUB per capita
Market Volume, $/€/RUB.
Map of demand in North Caucasus FD (regions where located cities with population over 500 thousand residents)
Consumer expenditures, $/€/RUB per capita
Market Volume, $/€/RUB.
Map of demand in Urals FD (regions where located cities with population over 500 thousand residents)
Consumer expenditures, $/€/RUB per capita
Market Volume, $/€/RUB.
Map of demand in Siberian FD (regions where located cities with population over 500 thousand residents)
Consumer expenditures, $/€/RUB per capita
Market Volume, $/€/RUB.
Map of demand in Far East FD (regions where located cities with population over 500 thousand residents)
Consumer expenditures, $/€/RUB per capita
Market Volume, $/€/RUB.
 Аналитика по рынку полукопченых колбас - структура ритейла, производства в России с прогнозом по 2030 г.
ROIF EXPERT
50 000 ₽
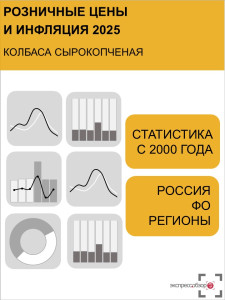 Цены на сырокопченые колбасы 2024: динамика в рознице и инфляция 2000 – январь 2024. Россия, федеральные округа, регионы
Экспресс-Обзор
55 000 ₽
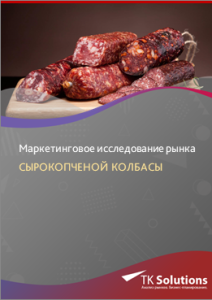 Маркетинговое исследование рынка сырокопченой колбасы в России 2016-2022 гг. Прогноз на 2022-2026 гг. Август 2022.
ТК Солюшнс
95 900 ₽
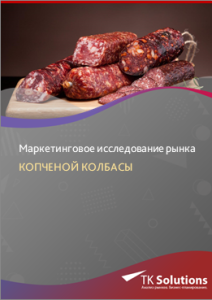 Маркетинговое исследование рынка копченой колбасы в России 2016-2022 гг. Прогноз на 2022-2026 гг. Август 2022.
ТК Солюшнс
95 900 ₽

 Статья, 30 января 2026
РБК Исследования рынков
Россияне охладели к ЗОЖ-меню в ресторанах, выбирая «понятную еду»
Российские посетители ресторанов отодвигают вопросы здорового питания на второй план при выборе заведений
Согласно данным опроса, представленным в обзоре «Российский рынок ресторанов среднего ценового сегмента 2025», за прошедший год заметно уменьшилась важность фактора «полезности еды» — с 25,1% до 22,6%. О некотором сдвиге в приоритетах говорит и снижение значимости для потребителей смены меню и появления новинок – соответствующий показатель упал на 2,1 п.п. до 7,6%.
 Статья, 30 января 2026
РБК Исследования рынков
Готовая еда из супермаркетов отбирает трафик у классических кофеен
Операторы рынка общепита фиксируют рост конкуренции со стороны продуктового ретейла
Сетевые супермаркеты активно развивают направление готовой еды (ready-to-eat) и кафе внутри магазинов, предлагая потребителю более низкую цену и высокую скорость обслуживания. Статистика, приведенная в обзоре «Российский рынок кофеен и кафе-кондитерских 2025», подтверждает: аудитория кофеен не ограничивается одним форматом и активно переключается на предложения конкурентов.
― Каким был 2024 год для вашей компании? Удалось ли достичь намеченных финансовых показателей и реализовать планы по развитию? Какие факторы оказали наибольшее влияние на бизнес?