Maps of demand by ‘Express-Obzor’ consist of 18 main slides (2 slides per each of 9 regional groups):
Map of demand on sausages and sausage products in RussiaConsumer expenditures, $/€/RUB per capita
Market Volume, $/€/RUB.
Map of demand on sausages and sausage products in Central FD (regions where located cities with population over 500 thousand residents)Consumer expenditures, $/€/RUB per capita
Market Volume, $/€/RUB.
Map of demand on sausages and sausage products in Northwest FD (regions where located cities with population over 500 thousand residents)Consumer expenditures, $/€/RUB per capita
Market Volume, $/€/RUB.
Map of demand on sausages and sausage products in Volga FD (regions where located cities with population over 500 thousand residents)Consumer expenditures, $/€/RUB per capita
Market Volume, $/€/RUB.
Map of demand on sausages and sausage products in Southern FD (regions where located cities with population over 500 thousand residents)Consumer expenditures, $/€/RUB per capita
Market Volume, $/€/RUB.
Map of demand on sausages and sausage products in North Caucasus FD (regions where located cities with population over 500 thousand residents)Consumer expenditures, $/€/RUB per capita
Market Volume, $/€/RUB.
Map of demand on sausages and sausage products in Urals FD (regions where located cities with population over 500 thousand residents)Consumer expenditures, $/€/RUB per capita
Market Volume, $/€/RUB.
Map of demand on sausages and sausage products in Siberian FD (regions where located cities with population over 500 thousand residents)Consumer expenditures, $/€/RUB per capita
Market Volume, $/€/RUB.
Map of demand on sausages and sausage products in Far East FD (regions where located cities with population over 500 thousand residents)Consumer expenditures, $/€/RUB per capita
Market Volume, $/€/RUB.
About the company
Company Express-Obzor –since 2005 has been specializing in ready-made analytical market reports. Reports made my Express-Obzor’s specialists give an opportunity to receive basic information and a general idea of a market situation in a concise way. All assessments obtained in the course of a research are independent and impartial.
Over the past 7 years of activity the company:
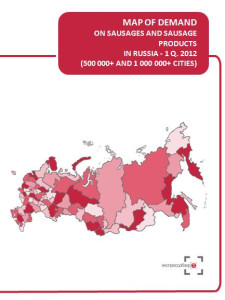
MAP OF DEMAND ON SAUSAGES AND SAUSAGE PRODUCTS RUSSIA, 1 q. 2012
1
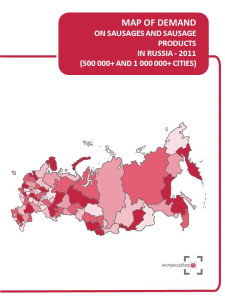
Map of demand in Russia
2
Consumer expenditures, $/€/RUB per capita
3
Market Volume, $/€/RUB.
4
Map of demand in Central FD (regions where located cities with population over 500 thousand residents)
5
Consumer expenditures, $/€/RUB per capita
6
Market Volume, $/€/RUB.
7
Map of demand in Northwest FD (regions where located cities with population over 500 thousand residents)
8
Consumer expenditures, $/€/RUB per capita
9
Market Volume, $/€/RUB.
10
Map of demand in Volga FD (regions where located cities with population over 500 thousand residents)
11
Consumer expenditures, $/€/RUB per capita
12
Market Volume, $/€/RUB.
13
Map of demand in Southern FD (regions where located cities with population over 500 thousand residents)
14
Consumer expenditures, $/€/RUB per capita
15
Market Volume, $/€/RUB.
16
Map of demand in North Caucasus FD (regions where located cities with population over 500 thousand residents)
17
Consumer expenditures, $/€/RUB per capita
18
Market Volume, $/€/RUB.
19
Map of demand in Urals FD (regions where located cities with population over 500 thousand residents)
20
Consumer expenditures, $/€/RUB per capita
21
Market Volume, $/€/RUB.
22
Map of demand in Siberian FD (regions where located cities with population over 500 thousand residents)
23
Consumer expenditures, $/€/RUB per capita
24
Market Volume, $/€/RUB.
25
Map of demand in Far East FD (regions where located cities with population over 500 thousand residents)
26
Consumer expenditures, $/€/RUB per capita
27
Market Volume, $/€/RUB.
28
В 2023 году совокупная выручка российских компаний, работающих в сегменте розничной торговли посудой и товарами для дома, достигла рекордных 17,8 млрд рублей. Это в 5,2 раза больше, чем годом ранее — столь резкий скачок может объясняться как реальным ростом продаж, так и особенностями выборок и методологии официальной статистики. Среднегодовой темп роста (CAGR) за период с 2005 по 2023 год составил 18,6%, что подчеркивает уверенное развитие отрасли на протяжении последних лет. В январе–сентябре 2024 года совокупная выручка отрасли достигла 11,6 млрд рублей, и, по предварительным оценкам, по итогам года рынок вырос примерно на 13%, вплотную приблизившись к отметке в 20 млрд рублей.
В ходе исследования, проведенного NeoAnalytics на тему «Российский рынок замороженных полуфабрикатов: итоги 2024 г., прогноз до 2028 г.», выяснилось, что в 2024 г. объем рынка составил около более 350 млрд. руб. и увеличился на 12%. На фоне положительной динамики основных макроэкономических показателей, таких как прирост оборота розничной торговли и денежные доходы населения, объем рынка полуфабрикатов в 2024 г. также демонстрировал рост. Данная продукция всегда имеет спрос со стороны покупателей, что сказывается на интенсивной динамике ее потребления. При этом, наибольший прирост был зафиксирован в 2021 г. после замедления динамики в 2020 г.
По данным «Анализа рынка канцелярских принадлежностей (канцтоваров) в России», подготовленного BusinesStat в 2025 г, в 2024 г их производство в стране сократилось на 19,5% и составило 3,7 млрд шт.