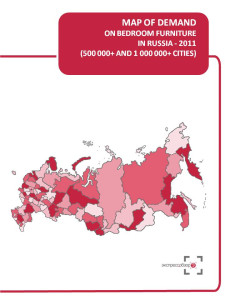


Maps of demand by ‘Express-Obzor’ consist of 18 main slides (2 slides per each of 9 regional groups):
Map of demand on bedroom furniture in RussiaMarket Volume, $/€/RUB.
Map of demand on bedroom furniture in Southern FD (regions where located cities with population over 500 thousand residents)
About the company
Company Express-Obzor –since 2005 has been specializing in ready-made analytical market reports. Reports made my Express-Obzor’s specialists give an opportunity to receive basic information and a general idea of a market situation in a concise way. All assessments obtained in the course of a research are independent and impartial.
Over the past 7 years of activity the company:
has attended to more then 800 clients
MAP OF DEMAND ON BEDROOM FURNITURE RUSSIA, 2011 | 1 |
Map of demand in Russia | 2 |
Consumer expenditures, $/€/RUB per capita | 3 |
Market Volume, $/€/RUB. | 4 |
Map of demand in Central FD | 5 |
Consumer expenditures, $/€/RUB per capita | 6 |
Market Volume, $/€/RUB. | 7 |
Map of demand in Northwest FD | 8 |
Consumer expenditures, $/€/RUB per capita | 9 |
Market Volume, $/€/RUB. | 10 |
Map of demand in Volga FD | 11 |
Consumer expenditures, $/€/RUB per capita | 12 |
Market Volume, $/€/RUB. | 13 |
Map of demand in Southern FD | 14 |
Consumer expenditures, $/€/RUB per capita | 15 |
Market Volume, $/€/RUB. | 16 |
Map of demand in North Caucasus FD | 17 |
Consumer expenditures, $/€/RUB per capita | 18 |
Market Volume, $/€/RUB. | 19 |
Map of demand in Urals FD | 20 |
Consumer expenditures, $/€/RUB per capita | 21 |
Market Volume, $/€/RUB. | 22 |
Map of demand in Siberian FD | 23 |
Consumer expenditures, $/€/RUB per capita | 24 |
Market Volume, $/€/RUB. | 25 |
Map of demand in Far East FD | 26 |
Consumer expenditures, $/€/RUB per capita | 27 |
Market Volume, $/€/RUB. | 28 |

 Статья, 6 февраля 2026
РБК Исследования рынков
«РБК Исследования рынков» изучили рынок мебели на маркетплейсах: итоги 2025 года
РБК провели собственную аналитику динамики продаж мебели на трех ведущих маркетплейсах — Wildberries, Ozon и «Яндекс Маркете» — на основе данных сервиса MPSTATS
Показатели площадок суммировались по категориям, при этом анализ совершался на основе использования статистики продаж по схеме FBO (хранение товаров и доставка осуществляется маркетплейсом).
 Статья, 5 февраля 2026
BusinesStat
Продажи свинины в России в 2021-2025 гг выросли на 16%: с 3,88 до 4,50 млн т.
В отличие от цен на птицу и другие виды мяса, цены на свинину достаточно стабильны.
По данным «Анализа рынка свинины в России», подготовленного BusinesStat в 2026 г, ее продажи в стране в 2021-2025 гг выросли на 16%: с 3,88 до 4,50 млн т.
 Статья, 5 февраля 2026
BusinesStat
Продажи хлеба и хлебобулочных изделий в России в 2025 г выросли на 1,5%: с 7,3 до 7,5 млн т.
Заметно растут продажи пирожков, пирогов и пончиков, удобных для перекуса "на ходу".
По данным «Анализа рынка хлеба и хлебобулочных изделий в России», подготовленного BusinesStat в 2026, их продажи в стране в 2025 г выросли на 1,5%: с 7,3 до 7,5 млн т.