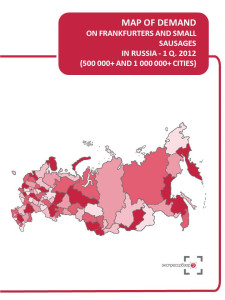


For your convenience we selected regions (subjects of RF) where located cities with population over 500 thousand residents. Map of demand is based on the statistics of these regions. Map of demand on frankfurters and small sausages displays expenditures per capita on purchased frankfurters and small sausages in rubles, $, € and market volume in rub/$/€/ in 1 q. 2012
Maps of demand by ‘Express-Obzor’ consist of 18 main slides (2 slides per each of 9 regional groups):
Map of demand on frankfurters and small sausages in Russia
Map of demand on frankfurters and small sausages in Central FD (regions where located cities with population over 500 thousand residents)
Map of demand on frankfurters and small sausages in Northwest FD (regions where located cities with population over 500 thousand residents)
Map of demand on frankfurters and small sausages in Volga FD (regions where located cities with population over 500 thousand residents)
Map of demand on frankfurters and small sausages in Southern FD (regions where located cities with population over 500 thousand residents)
Map of demand on frankfurters and small sausages in North Caucasus FD (regions where located cities with population over 500 thousand residents)
Map of demand on frankfurters and small sausages in Urals FD (regions where located cities with population over 500 thousand residents)
Map of demand on frankfurters and small sausages in Siberian FD (regions where located cities with population over 500 thousand residents)
Map of demand on frankfurters and small sausages in Far East FD (regions where located cities with population over 500 thousand residents)
About the company
Company Express-Obzor –since 2005 has been specializing in ready-made analytical market reports. Reports made my Express-Obzor’s specialists give an opportunity to receive basic information and a general idea of a market situation in a concise way. All assessments obtained in the course of a research are independent and impartial.
Over the past 7 years of activity the company:
MAP OF DEMAND ON FRANKFURTERS AND SMALL SAUSAGES RUSSIA, 1 q. 2012
1
Map of demand in Russia
2
Consumer expenditures, $/€/RUB per capita
3
Market Volume, $/€/RUB.
4
Map of demand in Central FD (regions where located cities with population over 500 thousand residents)
5
Consumer expenditures, $/€/RUB per capita
6
Market Volume, $/€/RUB.
7
Map of demand in Northwest FD (regions where located cities with population over 500 thousand residents)
8
Consumer expenditures, $/€/RUB per capita
9
Market Volume, $/€/RUB.
10
Map of demand in Volga FD (regions where located cities with population over 500 thousand residents)
11
Consumer expenditures, $/€/RUB per capita
12
Market Volume, $/€/RUB.
13
Map of demand in Southern FD (regions where located cities with population over 500 thousand residents)
14
Consumer expenditures, $/€/RUB per capita
15
Market Volume, $/€/RUB.
16
Map of demand in North Caucasus FD (regions where located cities with population over 500 thousand residents)
17
Consumer expenditures, $/€/RUB per capita
18
Market Volume, $/€/RUB.
19
Map of demand in Urals FD (regions where located cities with population over 500 thousand residents)
20
Consumer expenditures, $/€/RUB per capita
21
Market Volume, $/€/RUB.
22
Map of demand in Siberian FD (regions where located cities with population over 500 thousand residents)
23
Consumer expenditures, $/€/RUB per capita
24
Market Volume, $/€/RUB.
25
Map of demand in Far East FD (regions where located cities with population over 500 thousand residents)
26
Consumer expenditures, $/€/RUB per capita
27
Market Volume, $/€/RUB.
28
 Аналитика по рынку сосисок и сарделек - структура ритейла, производства в России с прогнозом по 2030 г.
ROIF EXPERT
50 000 ₽
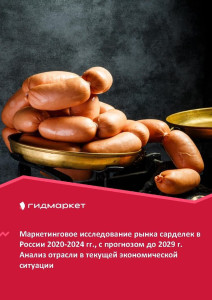 Маркетинговое исследование рынка сарделек в России 2015-2019гг., прогноз до 2024г.(с обновлением)
Компания Гидмаркет
199 000 ₽
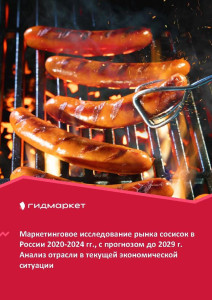 Маркетинговое исследование рынка сосисок в России 2015-2019гг., прогноз до 2024г.(с обновлением)
Компания Гидмаркет
199 000 ₽
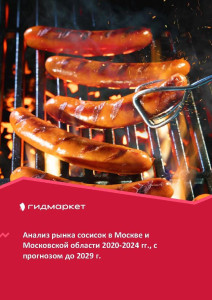 Маркетинговое исследование рынка сосисок в Москве и Московской области 2012-2016гг., прогноз до 2021г. (с обновлением)
Компания Гидмаркет
199 000 ₽

 Статья, 5 февраля 2026
BusinesStat
Продажи свинины в России в 2021-2025 гг выросли на 16%: с 3,88 до 4,50 млн т.
В отличие от цен на птицу и другие виды мяса, цены на свинину достаточно стабильны.
По данным «Анализа рынка свинины в России», подготовленного BusinesStat в 2026 г, ее продажи в стране в 2021-2025 гг выросли на 16%: с 3,88 до 4,50 млн т.
 Статья, 5 февраля 2026
BusinesStat
Продажи хлеба и хлебобулочных изделий в России в 2025 г выросли на 1,5%: с 7,3 до 7,5 млн т.
Заметно растут продажи пирожков, пирогов и пончиков, удобных для перекуса "на ходу".
По данным «Анализа рынка хлеба и хлебобулочных изделий в России», подготовленного BusinesStat в 2026, их продажи в стране в 2025 г выросли на 1,5%: с 7,3 до 7,5 млн т.
 Статья, 4 февраля 2026
BusinesStat
В 2023-2025 гг в России производство диагностических реагентов для медицинских лабораторий выросло на 10% и достигло 126 млн упаковок.
Отечественные компании оперативно разрабатывают и выпускают реагенты для наукоемких направлений (генетика, онкология, гистология).
По данным "Анализа рынка диагностических реагентов в России", подготовленного BusinesStat в 2026 г, в 2023-2025 гг производство диагностических реагентов для медицинских лабораторий в стране выросло на 10% и составило 126 млн упаковок.