

The major part of supply of gas cylinders in the Russian market is formed by production. In 2011, the share of production equalled 60% of the total supply volume, which made up 2,132 thousand units. The share of gas cylinder import in 2011 totaled 15%, which accounted for 520 thousand units. By the beginning of 2011, the in-stock balance of gas cylinders in the storages of industrial enterprises had amounted to 898 thousand units.
Russia is a net importer of gas cylinders, which means that the country imports more gas cylinders that exports. In 2007-2011, import of gas cylinders into Russia had a tendency towards reduction. Import dropped the most by 67.4% in 2009. In 2011, import of gas cylinders amounted to 520 thousand units; it turned out to be by 75% less than the rate of 2007.
The 2007-2016 Outlook for the Gas Cylinder Market in Russia contains the essential data, necessary to comprehend the current market opportunities and conditions and to assess the future prospects, covering such points as:
The report contains detailed information on the types of gas cylinders:
The survey of the Russian market gives a detailed account of the regions of the country. The report also includes data on the largest producers of gas cylinders.
The survey is based on the official statistics, obtained from:
Apart from the official statistics, the survey also contains the results of the research done by BusinesStat:
CONDITION OF THE RUSSIAN ECONOMY
CLASSIFICATION OF HIGH-PRESSURE GAS CYLINDERS
DEMAND FOR AND SUPPLY OF GAS CYLINDERS
USE OF GAS CYLINDERS
SALES OF GAS CYLINDERS
PRODUCTION OF GAS CYLINDERS
MANUFACTURERS OF GAS CYLINDERS
EXPORT AND IMPORT OF GAS CYLINDERS
ECONOMIC INDICATORS OF THE INDUSTRY
ECONOMIC PROFILES OF THE LEADING COMPANIES
The report contains 102 table
Table 1. Nominal and real GDP volumes, Russia, 2007-2016 (trillion rubles)
Table 2. Real GDP volume and its index, Russia, 2007-2016 (trillion rubles, %)
Table 3. Fixed investments from all sources of financing, Russia, 2007-2016 (trillion rubles, %)
Table 4. Export and import volumes and balance of trade, Russia, 2007-2016 (billion dollars)
Table 5. Average annual exchange rate of the US dollar to the ruble, Russia, 2006-2015 (RUR/USD, %)
Table 6. Consumer price index (the inflation rate) and producer price index, Russia, 2007-2016 (% to the previous year)
Table 7. Size of population inclusive of migrants, Russia 2006-2015 (million people)
Table 8. Real household income, Russia, 2006-2015 (% to the previous year)
Table 9. Examples of gas mixtures for branches of industry
Table 10. Properties of gas cylinders of little and middle volume
Table 11. Properties of gas cylinders of high volume (31.4 and 39.2 MPa)
Table 12. Properties of gas cylinders of high volume (up to 24.5 MPa)
Table 13. Frequency of technical examination of gas cylinders that are in service and are not liable
Table 14. Comparison of types of gas cylinders by material
Table 15. Comparison of types of gas cylinders by manufacturing method
Table 16. Volume of supply of gas cylinders, Russia, 2007-2011 (thousand units; %)
Table 17. Forecast of the volume of gas cylinder supply, Russia, 2012-2016 (thousand units; %)
Table 18. Production, import and in-stock balance of gas cylinders, Russia, 2007-2011 (thousand units)
Table 19. Forecast of production, import and in-stock balance of gas cylinders, Russia, 2012-2016 (thousand units)
Table 20. Volume of demand for gas cylinders, Russia, 2007-2011 (thousand units; %)
Table 21. Forecast of the volume of demand for gas cylinders, Russia, 2012-2016 (thousand units; %)
Table 22. Sales and export of gas cylinders, Russia, 2007-2011 (thousand units)
Table 23. Forecast of sales and export of gas cylinders, Russia, 2012-2016 (thousand units)
Table 24. Balance of demand for and supply of gas cylinders, including in-stock balance at the end of year, Russia, 2007-2011 (thousand units)
Table 25. Forecast of the balance of demand for and supply of gas cylinders, including in-stock balance at the end of year, Russia, 2012-2016 (thousand units)
Table 26. Number of gas cylinders in use, Russia, 2007-2011 (million units; %)
Table 27. Forecast of the number of gas cylinders in use, Russia, 2012-2016 (million units; %)
Table 28. Number of gas cylinders in use by type, Russia, 2007-2011 (million units)
Table 29. Forecast of the number of gas cylinders in use by type, Russia, 2012-2016 (million units)
Table 30. Average service life of gas cylinders by type, Russia, 2007-2011 (years)
Table 31. Forecast of the average service life of gas cylinders by type, Russia, 2012-2016 (years)
Table 32. Volume of sales of gas cylinders, Russia, 2007-2011 (thousand units; %)
Table 33. Forecast of the volume of gas cylinder sales, Russia, 2012-2016 (thousand units; %)
Table 34. Sales of gas cylinders by type, Russia, 2007-2011 (thousand units; %)
Table 35. Forecast of the volume of gas cylinder sales by type, Russia, 2012-2016 (thousand units; %)
Table 36. Value of sales of gas cylinders, Russia, 2007-2011 (million rubles; %)
Table 37. Forecast of the value of gas cylinder sales, Russia, 2012-2016 (million rubles; %)
Table 38. Sales of gas cylinders by type, Russia, 2007-2011 (million rubles; %)
Table 39. Forecast of the value of gas cylinder sales by type, Russia, 2012-2016 (million rubles; %)
Table 40. Wholesale price for gas cylinders, Russia, 2007-2011 (rubles per unit; %)
Table 41. Forecast of the wholesale price for gas cylinders, Russia, 2012-2016 (rubles per unit; %)
Table 42. Wholesale price for gas cylinders by type, Russia, 2007-2011 (rubles per unit; %)
Table 43. Forecast of the wholesale price for gas cylinders by type, Russia, 2012-2016 (rubles per unit; %)
Table 44. Correlation between the average wholesale price for gas cylinders and the inflation rate, Russia, 2007-2011 (%)
Table 45. Forecast of correlation between average wholesale price for gas cylinders and the inflation rate, Russia, 2012-2016 (%)
Table 46. Correlation among sales volume, sales value of and the average wholesale price for gas cylinders, Russia, 2007-2011 (thousand units; rubles per unit; million rubles)
Table 47. Forecast of correlation among sales volume, sales value of and the average wholesale price for gas cylinders, Russia, 2012-2016 гг (thousand units; rubles per unit; million rubles)
Table 48. Volume of production of gas cylinders, Russia, 2007-2011 (thousand units; %)
Table 49. Forecast of production volume of gas cylinders, Russia, 2012-2016 (thousand units; %)
Table 50. Production volume of gas cylinders by region, Russia, 2007-2011 (thousand units)
Table 51. Production volume of gas cylinders by type, Russia, 2007-2011 (thousand units; %)
Table 52. Forecast of production volume of gas cylinders by type, Russia, 2012-2016 (thousand units; %)
Table 53. Producer price for gas cylinders, Russia, 2007-2011 (rubles per unit; %)
Table 54. Forecast of the producer price for gas cylinders, Russia, 2012-2016 (rubles per unit; %)
Table 55. Producer price for gas cylinders by type, Russia, 2007-2011 (rubles per unit; %)
Table 56. Forecast of the producer price for gas cylinders by type, Russia, 2012-2016 (rubles per unit; %)
Table 57. Rating of gas cylinder manufacturers by production volume, Russia, 2010 (thousand units)
Table 58. Rating of gas cylinder manufacturers by profit (net), Russia, 2010 (million rubles)
Table 59. Rating of gas cylinder manufacturers by sales revenue, Russia, 2010 (million rubles)
Table 60. Rating of gas cylinder manufacturers by gross profit on sales, Russia, 2010 (%)
Table 61. Balance of gas cylinder export and import, Russia, 2007-2011 (thousand units)
Table 62. Forecast of balance of gas cylinder export and import, Russia, 2012-2016 (thousand units)
Table 63. Export of gas cylinders, Russia, 2007-2011 (thousand units; %)
Table 64. Forecast of gas cylinder export, Russia, 2012-2016 (thousand units; %)
Table 65. Export of gas cylinders by country, Russia, 2007-2011 (thousand units)
Table 66. Export of gas cylinders by type, Russia, 2007-2011 (thousand units)
Table 67. Forecast of gas cylinder export by type, Russia, 2012-2016 (thousand units)
Table 68. Export of gas cylinders, Russia, 2007-2011 (million USD; %)
Table 69. Forecast of gas cylinder export, Russia, 2012-2016 (million dollars; %)
Table 70. Export of gas cylinders by country, Russia, 2007-2011 (thousand dollars)
Table 71. Export of gas cylinders by type, Russia, 2007-2011 (million dollars)
Table 72. Forecast of gas cylinder export by type, Russia, 2012-2016 (million dollars)
Table 73. Export price for gas cylinders, Russia, 2007-2011 (dollars per unit; %)
Table 74. Forecast of export price for gas cylinders, Russia, 2012-2016 (dollars per unit; %)
Table 75. Export price for gas cylinders by country, Russia, 2007-2011 (dollars per unit)
Table 76. Export price for gas cylinders by type, Russia, 2007-2011 (dollars per unit)
Table 77. Forecast of the export price for gas cylinders by type, Russia, 2012-2016 (dollars per unit)
Table 78. Volume of import of gas cylinders, Russia, 2007-2011 (thousand units; %)
Table 79. Forecast of the volume of gas cylinders import, Russia, 2012-2016 (thousand units; %)
Table 80. Import of gas cylinders by country, Russia, 2007-2011 (units)
Table 81. Volume of gas cylinder import by type, Russia, 2007-2011 (thousand units)
Table 82. Forecast of the volume of gas cylinder import by type, Russia, 2012-2016 (thousand units)
Table 83. Value of import of gas cylinders, Russia, 2007-2011 (million dollars; %)
Table 84. Forecast of the value of gas cylinder import, Russia, 2012-2016 (million dollars; %)
Table 85. Import of gas cylinders by country, Russia, 2007-2011 (thousand dollars)
Table 86. Import of gas cylinders by type, Russia, 2007-2011 (million dollars)
Table 87. Forecast of gas cylinder import by type, Russia, 2012-2016 (million dollars)
Table 88. Import price for gas cylinders, Russia, 2007-2011 (dollars per unit; %)
Table 89. Forecast of the import price for gas cylinders, Russia, 2012-2016 (dollars per unit; %)
Table 90. Import price for gas cylinders by country, Russia, 2007-2011 (dollars per unit)
Table 91. Import price for gas cylinders by type, Russia, 2007-2011 (dollars per unit)
Table 92. Forecast of the import price for gas cylinders by country, Russia, 2012-2016 (dollars per unit)
Table 93. Recipients of Gas Cylinders, Russia, 2012
Table 94. Recipients of Fire Extinguishers, Russia, 2012
Table 95. Sales revenue (net), Russia, 2007-2011 (billion RUR; %)
Table 96. Commercial and administrative expenses, Russia, 2007-2011 (billion RUR; %)
Table 97. Net cost, Russia, 2007-2011 (billion rubles; %)
Table 98. Gross profit on sales, Russia, 2007-2011 (billion rubles; %)
Table 99. Economic efficiency of the industry, Russia, 2007-2011 (%; times; days)
Table 100. Investments into the branch, Russia, 2007-2011 (million rubles)
Table 101. Labor resources of the branch, Russia, 2007-2011 (thousand people; %)
Table 102. Average salary, Russia, 2007-2011 (thousand rubles per year; %)
 Анализ рынка радиаторов отопления в России в 2018-2022 гг, прогноз на 2023-2027 гг в условиях санкций
BusinesStat
85 000 ₽
 Маркетинговое исследование рынка радиаторов центрального отопления в России 2017-2021 гг., прогноз до 2026 г. (с обновлением)
Компания Гидмаркет
99 000 ₽
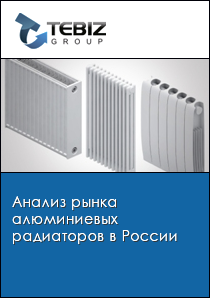 Рынок алюминиевых радиаторов в России - 2021. Показатели и прогнозы
TEBIZ GROUP
94 900 ₽
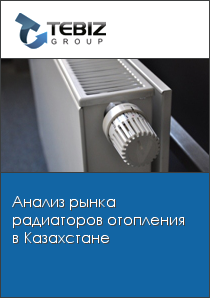 Анализ рынка радиаторов отопления в Казахстане - 2020. Текущая ситуация и прогноз
TEBIZ GROUP
79 900 ₽

― Каким был 2023 год для вашей компании? Удалось ли достичь намеченных финансовых показателей и реализовать планы по развитию? Насколько ситуация изменилась в сравнении с прошлогодней?

— Каким был 2022 год для вашей компании? Удалось ли достичь намеченных финансовых показателей и реализовать планы по развитию?

 Статья, 25 апреля 2024
AnalyticResearchGroup (ARG)
Развитию банковских сервисов для бизнеса способствует продолжающийся рост объема безналичных платежей
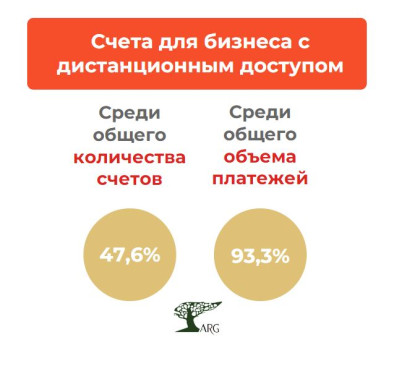
По результатам первого полугодия прошлого года уже свыше 90% от общего объема платежей, проводимых юрлицами в России, совершалось в электронном виде.
На российском платежном рынке онлайн-транзакции продолжают удерживать лидирующие позиции как с точки зрения доступа клиентов к расчетным счетам, так и по проводимым платежам. Например, если по состоянию на начало 2008 года в России действовало лишь 1,3 млн. счетов юридических лиц с дистанционным доступом, а их доля в общем числе счетов составляла около 23%, то по состоянию на начало 2023 года таких счетов было уже 8,5 млн., а доля в общем количестве превышала 50%.