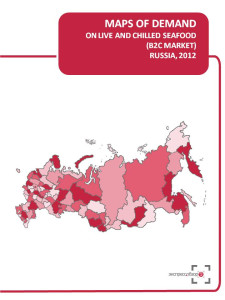


Map of demand on live and chilled seafood displays expenses per capita on purchased live and chilled seafood in rubles, $, €/RUB and market volume in amount of rub/$ in 2012.
Maps of demand by ‘Express-Obzor’ consist of 18 main slides (2 slides per each of 9 regional groups):
Map of demand on live and chilled seafood in Russia
Consumer expenses, $ per capita
Market Volume, $.
Map of demand on live and chilled seafood in Central FD
Consumer expenses, $ per capita
Market Volume, $.
Map of demand on live and chilled seafood in Northwest FD
Consumer expenses, $ per capita
Market Volume, $.
Map of demand on live and chilled seafood in Volga FD
Consumer expenses, $ per capita
Market Volume, $.
Map of demand on live and chilled seafood in Southern FD
Consumer expenses, $ per capita
Market Volume, $.
Map of demand on live and chilled seafood in North Caucasus FD
Consumer expenses, $ per capita
Market Volume, $.
Map of demand on live and chilled seafood in Urals FD
Consumer expenses, $ per capita
Market Volume, $.
Map of demand on live and chilled seafood in Siberian FD
Consumer expenses, $ per capita
Market Volume, $.
Map of demand on live and chilled seafood in Far East FD
Consumer expenses, $ per capita
Market Volume, $.
About the company
Company Express-Obzor since 2005 has been specializing in ready-made analytical market reports. Reports made my Express-Obzor’s specialists give an opportunity to receive basic information and a general idea of a market situation in a concise way. All assessments obtained in the course of a research are independent and impartial.
Over the past 8 years of activity the company:
MAPS OF DEMAND ON LIVE AND CHILLED SEAFOOD (B2C MARKET), RUSSIA, 2012
1
Map of demand in Russia
2
Consumer expenses, $ per capita
3
Market Volume, $.
4
Map of demand in Central FD
5
Consumer expenses, $ per capita
6
Market Volume, $.
7
Map of demand in Northwest FD
8
Consumer expenses, $ per capita
9
Market Volume, $.
10
Map of demand in Volga FD
11
Consumer expenses, $ per capita
12
Market Volume, $.
13
Map of demand in Southern FD
14
Consumer expenses, $ per capita
15
Market Volume, $.
16
Map of demand in North Caucasus FD
17
Consumer expenses, $ per capita
18
Market Volume, $.
19
Map of demand in Urals FD
20
Consumer expenses, $ per capita
21
Market Volume, $.
22
Map of demand in Siberian FD
23
Consumer expenses, $ per capita
24
Market Volume, $.
25
Map of demand in Far East FD
26
Consumer expenses, $ per capita
27
Market Volume, $.
28
 Маркетинговое исследование рынка морепродуктов в России 2016-2022 гг. Прогноз на 2022-2026 гг. Август 2022.
ТК Солюшнс
95 900 ₽
 Рынок устриц в России - 2020. Показатели и прогнозы
TEBIZ GROUP
89 900 ₽
 Рынок ракообразных в России
TEBIZ GROUP
30 000 ₽
 Рынок морепродуктов в России - 2015. Показатели и прогнозы
TEBIZ GROUP
75 900 ₽

― Каким был 2024 год для вашей компании? Удалось ли достичь намеченных финансовых показателей и реализовать планы по развитию?

 Статья, 3 июля 2025
РБК Исследования рынков
На российском рынке одежды наблюдается кризис сетевого ретейла
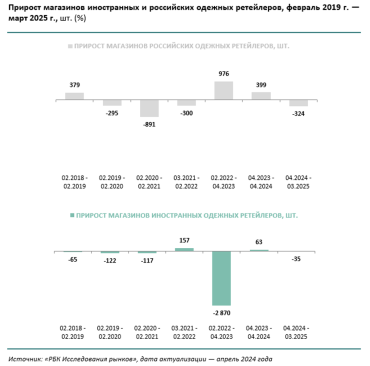
Представленность сетевых магазинов одежды в России снижается. По оценкам «РБК Исследований рынков», приведенным в обзоре «Одежный ретейл 2025», за апрель 2024 — март 2025 года их число сократилось на 1,7%.
В абсолютном выражение офлайн-розница за этот период потеряла 358 магазинов одежды. Тем самым, сетевой ретейл практически вернулся к историческому минимуму апреля 2023 года, когда был зафиксирован рекордный спад после ухода ряда крупных зарубежных сетей.
 Статья, 3 июля 2025
BusinesStat
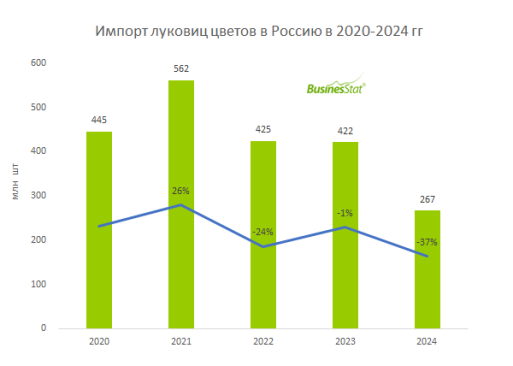
За 2020-2024 гг импорт луковиц цветов в Россию сократился на 40%: с 445 до 267 млн шт.
Российский рынок более чем на 80% состоит из импортной продукции.
По данным «Анализа рынка луковиц цветов в России», подготовленного BusinesStat в 2025 г, за 2020-2024 гг их импорт в страну сократился на 40%: с 445 до 267 млн шт.