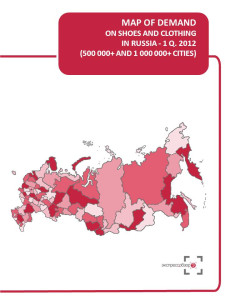


For your convenience we selected regions (subjects of RF) where located cities with population over 500 thousand residents. Map of demand is based on the statistics of these regions. Map of demand on shoes and clothing displays expenditures per capita on purchased shoes and clothing in rubles, $, € and market volume in rub/$/€/ in 1 q. 2012.
Maps of demand by ‘Express-Obzor’ consist of 18 main slides (2 slides per each of 9 regional groups):
Map of demand on shoes and clothing in Russia
Consumer expenditures, $/€/RUB per capita
Market Volume, $/€/RUB.
Map of demand on shoes and clothing in Central FD (regions where located cities with population over 500 thousand residents)
Consumer expenditures, $/€/RUB per capita
Market Volume, $/€/RUB.
Map of demand on shoes and clothing in Northwest FD (regions where located cities with population over 500 thousand residents)
Consumer expenditures, $/€/RUB per capita
Market Volume, $/€/RUB.
Map of demand on shoes and clothing in Volga FD (regions where located cities with population over 500 thousand residents)
Consumer expenditures, $/€/RUB per capita
Market Volume, $/€/RUB.
Map of demand on shoes and clothing in Southern FD (regions where located cities with population over 500 thousand residents)
Consumer expenditures, $/€/RUB per capita
Market Volume, $/€/RUB.
Map of demand on shoes and clothing in North Caucasus FD (regions where located cities with population over 500 thousand residents)
Consumer expenditures, $/€/RUB per capita
Market Volume, $/€/RUB.
Map of demand on shoes and clothing in Urals FD (regions where located cities with population over 500 thousand residents)
Consumer expenditures, $/€/RUB per capita
Market Volume, $/€/RUB.
Map of demand on shoes and clothing in Siberian FD (regions where located cities with population over 500 thousand residents)
Consumer expenditures, $/€/RUB per capita
Market Volume, $/€/RUB.
Map of demand on shoes and clothing in Far East FD (regions where located cities with population over 500 thousand residents)
Consumer expenditures, $/€/RUB per capita
Market Volume, $/€/RUB.
About the company
Company Express-Obzor –since 2005 has been specializing in ready-made analytical market reports. Reports made my Express-Obzor’s specialists give an opportunity to receive basic information and a general idea of a market situation in a concise way. All assessments obtained in the course of a research are independent and impartial.
Over the past 7 years of activity the company:
has attended to more then 800 clients
MAP OF DEMAND ON SHOES AND CLOTHING RUSSIA, 1 q. 2012
1
Map of demand in Russia
2
Consumer expenditures, $/€/RUB per capita
3
Market Volume, $/€/RUB.
4
Map of demand in Central FD (regions where located cities with population over 500 thousand residents)
5
Consumer expenditures, $/€/RUB per capita
6
Market Volume, $/€/RUB.
7
Map of demand in Northwest FD (regions where located cities with population over 500 thousand residents)
8
Consumer expenditures, $/€/RUB per capita
9
Market Volume, $/€/RUB.
10
Map of demand in Volga FD (regions where located cities with population over 500 thousand residents)
11
Consumer expenditures, $/€/RUB per capita
12
Market Volume, $/€/RUB.
13
Map of demand in Southern FD (regions where located cities with population over 500 thousand residents)
14
Consumer expenditures, $/€/RUB per capita
15
Market Volume, $/€/RUB.
16
Map of demand in North Caucasus FD (regions where located cities with population over 500 thousand residents)
17
Consumer expenditures, $/€/RUB per capita
18
Market Volume, $/€/RUB.
19
Map of demand in Urals FD (regions where located cities with population over 500 thousand residents)
20
Consumer expenditures, $/€/RUB per capita
21
Market Volume, $/€/RUB.
22
Map of demand in Siberian FD (regions where located cities with population over 500 thousand residents)
23
Consumer expenditures, $/€/RUB per capita
24
Market Volume, $/€/RUB.
25
Map of demand in Far East FD (regions where located cities with population over 500 thousand residents)
26
Consumer expenditures, $/€/RUB per capita
27
Market Volume, $/€/RUB.
28
 Рынок нижнего белья 2025
РБК Исследования рынков
49 000 ₽
 Исследование рынка мобильных приложений магазинов одежды в России: аналитика по результатам опроса пользователей (с обновлением)
Компания Гидмаркет
170 000 ₽
 Продажи женской обуви на маркетплейсах 2024
РБК Исследования рынков
55 000 ₽
 Продажи мужской обуви на маркетплейсках 2024
РБК Исследования рынков
55 000 ₽

 Статья, 9 декабря 2025
Компания Гидмаркет
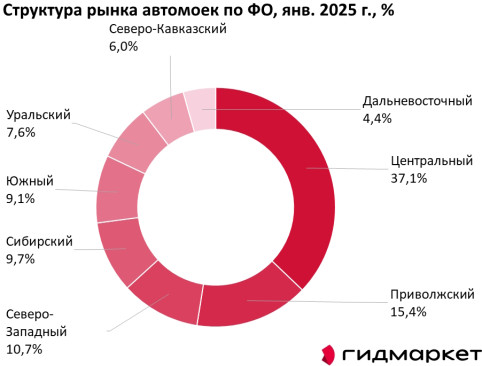
Центральный округ собрал более трети всех российских автомоек
На Центральный федеральный округ, включая Москву, приходится 37,1% всех автомоек в стране, что делает его абсолютным лидером по концентрации этого бизнеса
Российский рынок услуг по мойке автомобилей представляет собой динамичную и неравномерно распределенную по территории страны сферу предпринимательства. Его география напрямую отражает ключевые экономические и демографические реалии: плотность населения, уровень автомобилизации и покупательной способности граждан. Анализ структуры расположения автомоек по федеральным округам, основанный на данных на начало 2025 года, позволяет выявить четкие закономерности и центры притяжения для этого бизнеса.
 Статья, 9 декабря 2025
Компания Гидмаркет
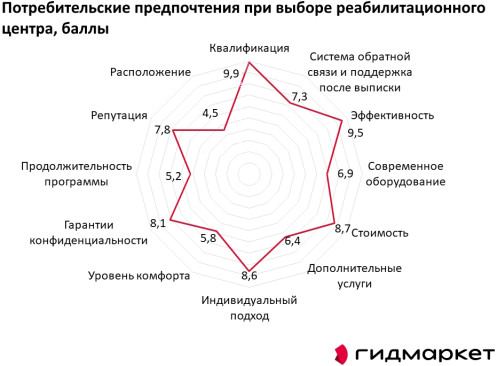
Как выбирают реабилитационный центр в 2024 году
Анализ потребительский предпочтений в контексте развития рынка медицинской реабилитации
Сфера медицинской реабилитации в России активно развивается. Всё больше людей понимают важность профессионального восстановления после болезней, операций или травм. Реабилитационный центр сегодня — это не просто место для ухода, а полноценное лечебное учреждение, где команда врачей, психологов и инструкторов помогает человеку вернуться к активной жизни.
 Статья, 9 декабря 2025
Компания Гидмаркет
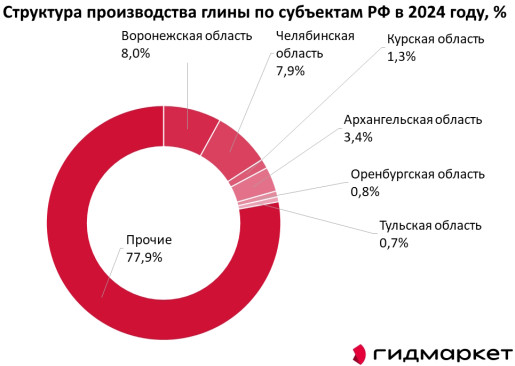
Центр России лидирует в производстве глины в 2024 году
Воронежская область стала лидером по производству глины в России в 2024 году, опередив Челябинскую область на 0,1%
Анализ географического распределения производства глины в России по итогам 2024 года выявил ярко выраженную концентрацию ключевых мощностей в европейской части страны.