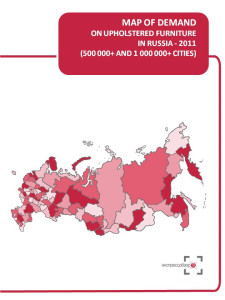


For your convenience we selected regions (subjects of RF) where located cities with population over 500 thousand residents. Map of demand is based on the statistics of these regions. Map of demand on upholstered furniture displays expenditures per capita on purchased upholstered furniture in rubles, $, € and market volume in rub/$/€/ in 2011.
Maps of demand by ‘Express-Obzor’ consist of 18 main slides (2 slides per each of 9 regional groups):
Map of demand on upholstered furniture in Russia
Map of demand on upholstered furniture in Central FD (regions where located cities with population over 500 thousand residents)
Map of demand on upholstered furniture in Northwest FD (regions where located cities with population over 500 thousand residents)
Map of demand on upholstered furniture in Volga FD (regions where located cities with population over 500 thousand residents)
Map of demand on upholstered furniture in Southern FD (regions where located cities with population over 500 thousand residents)
Map of demand on upholstered furniture in North Caucasus FD (regions where located cities with population over 500 thousand residents)
Map of demand on upholstered furniture in Urals FD (regions where located cities with population over 500 thousand residents)
Map of demand on upholstered furniture in Siberian FD (regions where located cities with population over 500 thousand residents)
Map of demand on upholstered furniture in Far East FD (regions where located cities with population over 500 thousand residents)
About the company
Company Express-Obzor –since 2005 has been specializing in ready-made analytical market reports. Reports made my Express-Obzor’s specialists give an opportunity to receive basic information and a general idea of a market situation in a concise way. All assessments obtained in the course of a research are independent and impartial.
Over the past 7 years of activity the company:
has attended to more then 800 clients
MAP OF DEMAND ON UPHOLSTERED FURNITURE RUSSIA, 2011
1
Map of demand in Russia
2
Consumer expenditures, $/€/RUB per capita
3
Market Volume, $/€/RUB.
4
Map of demand in Central FD (regions where located cities with population over 500 thousand residents)
5
Consumer expenditures, $/€/RUB per capita
6
Market Volume, $/€/RUB.
7
Map of demand in Northwest FD (regions where located cities with population over 500 thousand residents)
8
Consumer expenditures, $/€/RUB per capita
9
Market Volume, $/€/RUB.
10
Map of demand in Volga FD (regions where located cities with population over 500 thousand residents)
11
Consumer expenditures, $/€/RUB per capita
12
Market Volume, $/€/RUB.
13
Map of demand in Southern FD (regions where located cities with population over 500 thousand residents)
14
Consumer expenditures, $/€/RUB per capita
15
Market Volume, $/€/RUB.
16
Map of demand in North Caucasus FD (regions where located cities with population over 500 thousand residents)
17
Consumer expenditures, $/€/RUB per capita
18
Market Volume, $/€/RUB.
19
Map of demand in Urals FD (regions where located cities with population over 500 thousand residents)
20
Consumer expenditures, $/€/RUB per capita
21
Market Volume, $/€/RUB.
22
Map of demand in Siberian FD (regions where located cities with population over 500 thousand residents)
23
Consumer expenditures, $/€/RUB per capita
24
Market Volume, $/€/RUB.
25
Map of demand in Far East FD (regions where located cities with population over 500 thousand residents)
26
Consumer expenditures, $/€/RUB per capita
27
Market Volume, $/€/RUB.
28
 Мебельный ретейл России 2024.Статистика, тренды и прогнозы
РБК Исследования рынков
Бесплатно
 Pro-новости рынка мебели
РБК Исследования рынков
Бесплатно
 Маркетинговое исследование рынка мягкой мебели в России 2017-2021 гг., прогноз до 2026 г. (с обновлением)
Компания Гидмаркет
199 000 ₽
 Рынок диванов в России - 2020. Показатели и прогнозы
TEBIZ GROUP
89 900 ₽

 Статья, 5 февраля 2026
BusinesStat
Продажи свинины в России в 2021-2025 гг выросли на 16%: с 3,88 до 4,50 млн т.
В отличие от цен на птицу и другие виды мяса, цены на свинину достаточно стабильны.
По данным «Анализа рынка свинины в России», подготовленного BusinesStat в 2026 г, ее продажи в стране в 2021-2025 гг выросли на 16%: с 3,88 до 4,50 млн т.
 Статья, 5 февраля 2026
BusinesStat
Продажи хлеба и хлебобулочных изделий в России в 2025 г выросли на 1,5%: с 7,3 до 7,5 млн т.
Заметно растут продажи пирожков, пирогов и пончиков, удобных для перекуса "на ходу".
По данным «Анализа рынка хлеба и хлебобулочных изделий в России», подготовленного BusinesStat в 2026, их продажи в стране в 2025 г выросли на 1,5%: с 7,3 до 7,5 млн т.
 Статья, 4 февраля 2026
BusinesStat
В 2023-2025 гг в России производство диагностических реагентов для медицинских лабораторий выросло на 10% и достигло 126 млн упаковок.
Отечественные компании оперативно разрабатывают и выпускают реагенты для наукоемких направлений (генетика, онкология, гистология).
По данным "Анализа рынка диагностических реагентов в России", подготовленного BusinesStat в 2026 г, в 2023-2025 гг производство диагностических реагентов для медицинских лабораторий в стране выросло на 10% и составило 126 млн упаковок.