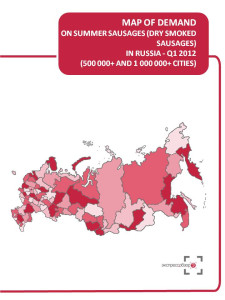


For your convenience we selected regions (subjects of RF) where located cities with population over 500 thousand residents. Map of demand is based on the statistics of these regions. Map of demand on summer sausages (dry smoked sausages) displays expenditures per capita on purchased summer sausages (dry smoked sausages) in rubles, $, € and market volume in rub/$/€/ in Q1 2012.
Maps of demand by ‘Express-Obzor’ consist of 18 main slides (2 slides per each of 9 regional groups):
Map of demand on summer sausages (dry smoked sausages) in Russia
Map of demand on summer sausages (dry smoked sausages) in Central FD (regions where located cities with population over 500 thousand residents)
Map of demand on summer sausages (dry smoked sausages) in Northwest FD (regions where located cities with population over 500 thousand residents)
Map of demand on summer sausages (dry smoked sausages) in Volga FD (regions where located cities with population over 500 thousand residents)
Map of demand on summer sausages (dry smoked sausages) in Southern FD (regions where located cities with population over 500 thousand residents)
Map of demand on summer sausages (dry smoked sausages) in North Caucasus FD (regions where located cities with population over 500 thousand residents)
Map of demand on summer sausages (dry smoked sausages) in Urals FD (regions where located cities with population over 500 thousand residents)
Map of demand on summer sausages (dry smoked sausages) in Siberian FD (regions where located cities with population over 500 thousand residents)
Map of demand on summer sausages (dry smoked sausages) in Far East FD (regions where located cities with population over 500 thousand residents)
About the company
Company Express-Obzor –since 2005 has been specializing in ready-made analytical market reports. Reports made my Express-Obzor’s specialists give an opportunity to receive basic information and a general idea of a market situation in a concise way. All assessments obtained in the course of a research are independent and impartial.
Over the past 7 years of activity the company:
MAP OF DEMAND ON SUMMER SAUSAGES (DRY SMOKED SAUSAGES) RUSSIA, Q1 2012
1
Map of demand in Russia
2
Consumer expenditures, $/€/RUB per capita
3
Market Volume, $/€/RUB.
4
Map of demand in Central FD (regions where located cities with population over 500 thousand residents)
5
Consumer expenditures, $/€/RUB per capita
6
Market Volume, $/€/RUB.
7
Map of demand in Northwest FD (regions where located cities with population over 500 thousand residents)
8
Consumer expenditures, $/€/RUB per capita
9
Market Volume, $/€/RUB.
10
Map of demand in Volga FD (regions where located cities with population over 500 thousand residents)
11
Consumer expenditures, $/€/RUB per capita
12
Market Volume, $/€/RUB.
13
Map of demand in Southern FD (regions where located cities with population over 500 thousand residents)
14
Consumer expenditures, $/€/RUB per capita
15
Market Volume, $/€/RUB.
16
Map of demand in North Caucasus FD (regions where located cities with population over 500 thousand residents)
17
Consumer expenditures, $/€/RUB per capita
18
Market Volume, $/€/RUB.
19
Map of demand in Urals FD (regions where located cities with population over 500 thousand residents)
20
Consumer expenditures, $/€/RUB per capita
21
Market Volume, $/€/RUB.
22
Map of demand in Siberian FD (regions where located cities with population over 500 thousand residents)
23
Consumer expenditures, $/€/RUB per capita
24
Market Volume, $/€/RUB.
25
Map of demand in Far East FD (regions where located cities with population over 500 thousand residents)
26
Consumer expenditures, $/€/RUB per capita
27
Market Volume, $/€/RUB.
28
 Аналитика по рынку полукопченых колбас - структура ритейла, производства в России с прогнозом по 2030 г.
ROIF EXPERT
50 000 ₽
 Цены на сырокопченые колбасы 2024: динамика в рознице и инфляция 2000 – январь 2024. Россия, федеральные округа, регионы
Экспресс-Обзор
45 000 ₽
 Маркетинговое исследование рынка сырокопченой колбасы в России 2016-2022 гг. Прогноз на 2022-2026 гг. Август 2022.
ТК Солюшнс
95 900 ₽
 Маркетинговое исследование рынка копченой колбасы в России 2016-2022 гг. Прогноз на 2022-2026 гг. Август 2022.
ТК Солюшнс
95 900 ₽

 Статья, 14 июля 2025
BusinesStat
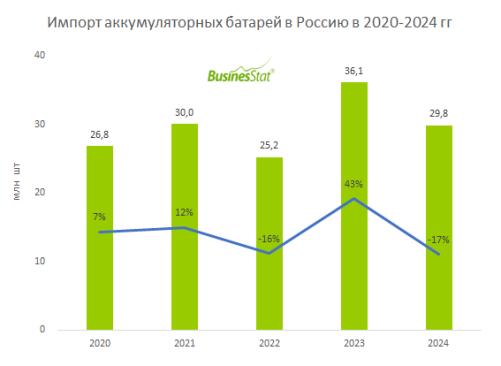
За 2020-2024 гг импорт аккумуляторных батарей в Россию вырос на 11%: с 26,8 до 29,8 млн шт.
70% зарубежных поставок занимают литий-ионные батареи.
По данным «Анализа рынка аккумуляторных батарей в России», подготовленного BusinesStat в 2025 г, российский рынок аккумуляторных батарей более чем на 80% состоит из импортной продукции. При этом за 2020-2024 гг импорт аккумуляторных батарей в Россию вырос на 11%: с 26,8 до 29,8 млн шт. В структуре импорта преобладают литий-ионные батареи (70% зарубежных поставок в 2024 г) и гидридно-никелевые батареи (23%).
Российский рынок закаленного безопасного стекла отражает положительную тенденцию роста своей объемности, корректировку средних контрактных цен при экспорте продукции за рубеж и рост контрактных цен на импортируемую продукцию. В то же время средние цены производителей закаленного безопасного стекла характеризуются относительной стабильностью
Российский рынок уксусной кислоты в сложившейся ситуации показывает устойчивую положительную тенденцию роста своей объемности, средних контрактных цен при экспорте продукции за рубеж и контрактных цен на импортируемую продукцию. В то же время средние цены производителей уксусной кислоты характеризуются ростом.