

According to BusinesStat, turnover of the healthcare market of Yaroslavl increased by 8.5 % and reached 3.7 billion rubles in 2012. OMI accounts for the major part of medical services, which share in the value of the market equaled 61% in 2012.
Along with that, the OMI services comprised 84% of the market volume. The reason for that difference is the lower costs of services under policy of obligatory medical insurance as compared to commercial healthcare; in 2012, the average cost of appointment of a patient under OMI equaled 316.9 rubles compared with the average market cost of 437.3 rubles. The OMI services are paid by the state that is why they are strictly regulated and detailed in the tariff agreement.
High costs of commercial services are connected mostly to high expenditures of clinics: purchasing of imported equipment and medications, high salaries of qualified personnel, rentals of large areas that are conveniently situated and so on. Thus, in 2008-2012, salary of a medical worker rose by 44% and totaled 205.8 thousand rubles per year.
The 2008-2017 Outlook for the Healthcare Services in Yaroslavl contains the essential data, necessary to comprehend the current market opportunities and to assess the future prospects of development in the market. The outlook introduces statistics of medical facilities and personnel, patients, appointments, costs of appointment, the volume and value of the market, financial and investment activities of the industry.
The outlook contains the following specifications:
Detailed profiles of 5 leading companies are given in addition.
Along with the outlook of the Yaroslavl market, BusinesStat offers outlooks of the healthcare markets of other big cities of Russia and of the Russian market on the whole.
The main source of information for the outlook is the unique BusinesStat research:
Additional sources of information are the data on core public organs and scientific and research organizations:
LEVEL OF HEALTH OF THE POPULATION
INFRASTRUCTURE OF HEALTHCARE
RATING OF HEALTHCARE FACILITIES
NUMBER OF APPOINTMENTS RENDERED
VALUE OF THE MARKET OF MEDICAL APPOINTMENTS
AVERAGE COST OF MEDICAL APPOINTMENTS
THE SECTOR OF OMI
SECTOR OF LEGAL COMMERCIAL HEALTHCARE
SECTOR OF SHADOW HEALTHCARE
SECTOR OF VOLUNTARY MEDICAL INSURANCE
PROFILES OF MEDICAL FACILITIES
The report contains 89 table
Table 1. Sickness rate of the population, Yaroslavl, 2008-2012 (number of cases per 100 thousand people)
Table 2. Sickness rate of the population by disease, Yaroslavl, 2008-2012 (number of cases per 100 thousand people)
Table 3. Sickness rate of the population by age, Yaroslavl, 2012 (number of cases per 100 thousand people)
Table 4. Duration of temporary disability, Yaroslavl, 2008-2012 (days per 100 employed)
Table 5. Number of cases of temporary disability, Yaroslavl, 2008-2012 (cases per 100 employed)
Table 6. Number of healthcare facilities by type, Yaroslavl, 2012
Table 7. Number of healthcare facilities by form of property, Yaroslavl, 2012
Table 8. Capacity of ambulatory and outpatient facilities, Yaroslavl, 2012 (thousand of visits per shift)
Table 9. Number of medical workers at healthcare facilities, Yaroslavl, 2008-2012 (thousand people)
Table 10. Number of medical workers at healthcare facilities by level of medical qualification, Yaroslavl, 2012 (thousand people)
Table 11. Average salary of a medical institution worker, Yaroslavl, 2008-2012 (thousand rubles per year)
Table 12. Rating of medical facilities by revenue from all activities, Yaroslavl, 2011 (million rubles)
Table 13. Number of consumers of healthcare services, Yaroslavl, 2008-2012 (thousand people)
Table 14. Forecast of the number of healthcare services consumers, Yaroslavl, 2013-2017 (thousand people)
Table 15. Average number of medical appointments rendered per patient, Yaroslavl, 2008-2012
Table 16. Forecast of average number of medical appointments rendered per patient, Yaroslavl, 2013-2017
Table 17. Number of consumers of healthcare services of legal commercial medicine, shadow medicine, OMI and VMI, Yaroslavl, 2008-2012 (thousand people)
Table 18. Forecast of the number consumers of healthcare services of legal commercial medicine, shadow medicine, OMI and VMI, Yaroslavl, 2013-2017 (thousand people)
Table 19. Number of appointments rendered, Yaroslavl, 2008-2012 (million appointments)
Table 20. Forecast of the number of appointments rendered, Yaroslavl, 2013-2017 (million appointments)
Table 21. Number of appointments rendered by healthcare sector: legal, shadow healthcare, OMI, VMI, Yaroslavl, 2008-2012 (million appointments)
Table 22. Forecast of the number of appointments rendered by healthcare sector: legal, shadow healthcare, OMI, VMI, Yaroslavl, 2013-2017 (million appointments)
Table 23. Value of the healthcare market, Yaroslavl, 2008-2012 (billion rubles)
Table 24. Forecast of the value of the healthcare market, Yaroslavl, 2013-2017 (billion rubles)
Table 25. Value of medical appointments by healthcare sector: legal, shadow healthcare, OMI and
VMI, Yaroslavl, 2008-2012 (billion rubles)
Table 26. Forecast of the value of medical appointments by healthcare sector: legal, shadow
healthcare, OMI and VMI, Yaroslavl, 2013-2017 (billion rubles)
Table 27. Sales revenue (net), Yaroslavl region, 2008-2012 (million rubles)
Table 28. Commercial and administrative expenses, Yaroslavl region, 2008-2012 (million rubles)
Table 29. Net cost, Yaroslavl region, 2008-2012 (million rubles)
Table 30. Gross profit on sales, Yaroslavl region, 2008-2012 (million rubles)
Table 31. Indices of investment attractiveness of healthcare, Yaroslavl region, 2008-2012
Table 32. Structure of investments in healthcare, Yaroslavl region, 2008-2012 (million rubles)
Table 33. Average cost of medical appointments, Yaroslavl, 2008-2012 (rubles)
Table 34. Forecast of the average cost of medical appointments, Yaroslavl, 2013-2017 (rubles)
shadow healthcare, OMI and VMI, Yaroslavl, 2008-2012 (rubles per appointment)
Table 35. Average costs of medical appointments by healthcare sector: legal commercial healthcare,
Table 36. Forecast of the average costs of medical appointments by healthcare sector: legal
commercial healthcare, shadow healthcare, OMI and VMI, Yaroslavl, 2013-2017 (rubles per
appointment)
Table 37. Average annual expenses on attending to a patient, Yaroslavl, 2008-2012 (thousand
Table 38. Forecast of the average annual expenses on attending to a patient, Yaroslavl, 2013-2017
rubles)
(thousand rubles)
Table 39. Number of medical appointments rendered in the sector of OMI, Yaroslavl, 2008-2012
(million appointments)
Yaroslavl, 2013-2017 (million appointments)
Table 40. Forecast of the number of medical appointments rendered in the sector of OMI,
Table 41. Number of patients of OMI, Yaroslavl, 2008-2012 (thousand people)
Table 42. Forecast of the number of patients of OMI, Yaroslavl, 2013-2017 (thousand people)
Table 43. Average number of medical appointments per patient in the sector of OMI, Yaroslavl,
2008-2012 (appointments)
Table 44. Forecast of the average number of medical appointments per patient in the sector of OMI,
Yaroslavl, 2013-2017 (appointments)
Table 45. Average annual expenditures per patient in the sector of OMI, Yaroslavl, 2008-2012
(thousand rubles)
Table 46. Forecast of the average annual expenditures per patient in the sector of OMI, Yaroslavl,
2013-2017 (thousand rubles)
Table 47. Value of OMI, Yaroslavl, 2008-2012 (billion rubles)
Table 48. Forecast of the value of OMI, Yaroslavl, 2013-2017 (billion rubles)
Table 49. Average costs of medical appointments under OMI, Yaroslavl, 2008-2012 (rubles per
Table 50. Forecast of the average costs of medical appointments under OMI, Yaroslavl, 2013-2017
appointment)
(rubles per appointment)
Table 51. Number of medical appointments rendered in the sector of legal commercial healthcare,
Yaroslavl, 2008-2012 (million appointments)
commercial healthcare, Yaroslavl, 2013-2017 (million appointments)
Table 52. Forecast of the number of medical appointments rendered in the sector of legal
Table 53. Number of patients of legal commercial healthcare, Yaroslavl, 2008-2012 (thousand people)
Table 54. Forecast of the number of patients of legal commercial healthcare, Yaroslavl, 2013-2017 (thousand people)
Table 55. Average number of medical appointments per patient in the sector of legal commercial
healthcare, Yaroslavl, 2008-2012 (thousand people)
Table 56. Forecast of the average number of medical appointments per patient in the sector of legal
commercial healthcare, Yaroslavl, 2013-2017 (appointments)
Table 57. Average annual expenses per patient in the sector of legal commercial healthcare,
Yaroslavl, 2008-2012 (appointments)
Table 58. Forecast of the average annual expenses per patient in the sector of legal commercial
healthcare, Yaroslavl, 2013-2017 (thousand rubles)
Table 60. Forecast of the value of legal commercial healthcare, Yaroslavl, 2013-2017 (billion
Table 59. Value of legal commercial healthcare, Yaroslavl, 2008-2012 (billion rubles)
rubles)
Table 61. Average costs of appointment in legal commercial healthcare, Yaroslavl, 2008-2012 (rubles per appointment)
Table 62. Forecast of the average costs of appointment in legal commercial healthcare, Yaroslavl, 2013-2017 (rubles per appointment)
Table 63. Number of shadow appointments rendered, Yaroslavl, 2008-2012 (million appointments)
Table 64. Forecast of the number of shadow appointments rendered, Yaroslavl, 2013-2017 (million
appointments)
Table 65. Number of patients in the sector of shadow healthcare, Yaroslavl, 2008-2012 (thousand people)
Table 66. Forecast of the number of the sector of shadow healthcare, Yaroslavl, 2013-2017 (thousand people)
Table 67. Share of patients of the sector of shadow healthcare in the population of Yaroslavl, 2008-2012 (%)
Table 68. Forecast of the share of patients of the sector of shadow healthcare in the population of Yaroslavl, 2013-2017 (%)
Table 69. Average number of appointments in the sector of shadow healthcare, Yaroslavl, 2008-2012 (appointments)
Table 70. Forecast of the average number of services per patient in the sector of shadow healthcare, Yaroslavl, 2013-2017 (appointments)
Table 71. Average annual expenses of a patient in the sector of shadow healthcare, Yaroslavl, 2008-2012 (thousand rubles)
Table 72. Forecast of the average annual expenses of a patient in the sector of shadow healthcare, Yaroslavl, 2013-2017 (thousand rubles)
Table 73. Value of the shadow healthcare market, Yaroslavl, 2008-2012 (billion rubles)
Table 74. Forecast of the value of the shadow healthcare market, Yaroslavl, 2013-2017 (billion rubles)
Table 75. Average costs of shadow appointments, Yaroslavl, 2008-2012 (rubles per appointment)
Table 76. Forecast of the average costs of shadow appointments, Yaroslavl, 2013-2017 (rubles per appointment)
Table 77. Volume of the sector of VMI, Yaroslavl, 2008-2012 (million appointments)
Table 78. Forecast of the volume of the sector of VMI, Yaroslavl, 2013-2017 (million appointments)
Table 79. Number of patients of the sector of VMI and their share in the population, Yaroslavl, 2008-2012 (thousand people)
Table 80. Forecast of the number of patients of the sector of VMI and their share in the population, Yaroslavl, 2013-2017 (thousand people)
Table 81. Average number of appointments per patient in the sector of VMI, Yaroslavl, 2008-2012 (appointments)
Table 82. Forecast of the average number of services per patient in the sector of VMI, Yaroslavl, 2013-2017 (appointments)
Table 83. Average annual expenses of a patient under VMI, Yaroslavl, 2008-2012 (thousand rubles)
Table 84. Forecast of the average annual expenses of a patient on VMI, Yaroslavl, 2013-2017(thousand rubles)
Table 85. Bonuses and reimbursements under VMI, Yaroslavl, 2008-2012 (billion rubles)
Table 86. Value of the sector of VMI, Yaroslavl, 2008-2012 (billion rubles)
Table 87. Forecast of the value of the sector of VMI, Yaroslavl, 2013-2017 (billion rubles)
Table 88. Average cost of appointment in the sector of VMI, Yaroslavl, 2008-2012 (rubles per appointment)
Table 89. Forecast of the average cost of услуги in the sector of VMI, Yaroslavl, 2013-2017 (rubles per appointment)
 Анализ рынка медицинских услуг в Узбекистане в 2018-2022 гг, прогноз на 2023-2027 гг
BusinesStat
100 000 ₽
 Анализ рынка медицинских услуг в Татарстане в 2018-2022 гг, прогноз на 2023-2027 гг
BusinesStat
100 000 ₽
 Готовый бизнес-план медицинского центра со стационаром и оперблоком
ЭКЦ "ИнвестПроект"
54 900 ₽
 Бизнес-план медицинской лаборатории по франшизе "Гемотест" (с финансовой моделью)
ЭКЦ "ИнвестПроект"
26 900 ₽
 Статья, 23 апреля 2024
BusinesStat
В 2023 г услугами коммерческих медучреждений в Москве воспользовались 40% жителей города.
Москвичи удовлетворены качеством услугам коммерческой медицины.
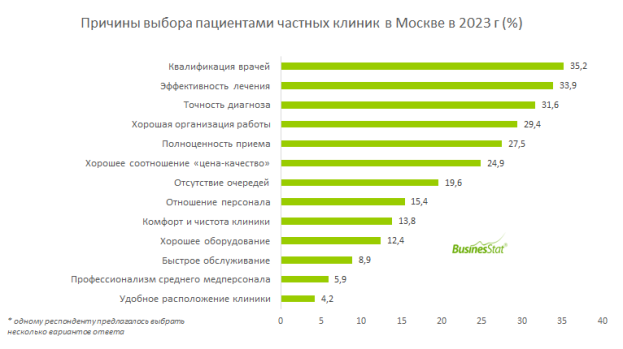
По данным «Рейтинга частных клиник Москвы по лояльности клиентов», подготовленного BusinesStat в 2024 г, в 2023 г услугами коммерческих медучреждений в Москве воспользовались 40% населения. Большинство респондентов оценили степень удовлетворенности услугами платной медицины как «хорошую». Высокая оценка услуг частных клиник связана с тем, что организация работы и уровень сервиса в коммерческой медицине выгодно отличается от госсектора.
 Статья, 19 апреля 2024
BusinesStat
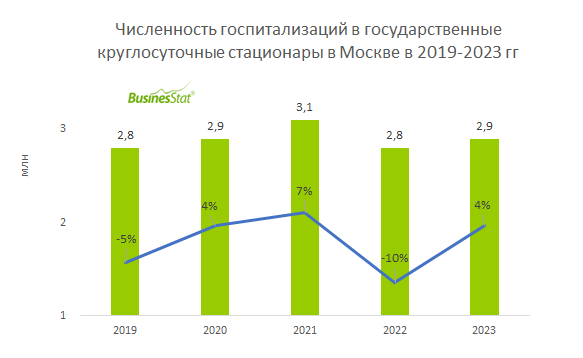
В 2023 г численность госпитализаций в государственные круглосуточные стационары Москвы увеличилась на 4% до 2,9 млн случаев.
Начали работу сразу несколько мощных флагманских центров столичных больниц.
По данным «Анализа рынка стационарных медицинских услуг в Москве», подготовленного BusinesStat в 2024 г, в 2023 г численность госпитализаций в государственные круглосуточные стационары Москвы увеличилась на 4% до 2,9 млн случаев. Доступность госмедицины в столице растет.