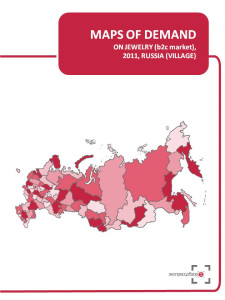


Map of demand on jewelry displays expenses per capita on purchased jewelry and market volume in amount of rub/$ in 2011.
Maps of demand by ‘Express-Obzor’ consist of 18 main slides (2 slides per each of 9 regional groups):
Map of demand on jewelry in the villages of Russia
Consumer expenses, $ per capita
Market Volume, $.
Map of demand on jewelry in the villages of Central FD
Consumer expenses, $ per capita
Market Volume, $.
Map of demand on jewelry in the villages of Northwest FD
Consumer expenses, $ per capita
Market Volume, $.
Map of demand on jewelry in the villages of Volga FD
Consumer expenses, $ per capita
Market Volume, $.
Map of demand on jewelry in the villages of Southern FD
Consumer expenses, $ per capita
Market Volume, $.
Map of demand on jewelry in the villages of North Caucasus FD
Consumer expenses, $ per capita
Market Volume, $.
Map of demand on jewelry in the villages of Urals FD
Consumer expenses, $ per capita
Market Volume, $.
Map of demand on jewelry in the villages of Siberian FD
Consumer expenses, $ per capita
Market Volume, $.
Map of demand on jewelry in the villages of Far East FD
Consumer expenses, $ per capita
Market Volume, $.
About the company
Company Express-Obzor since 2005 has been specializing in ready-made analytical market reports. Reports made my Express-Obzor’s specialists give an opportunity to receive basic information and a general idea of a market situation in a concise way. All assessments obtained in the course of a research are independent and impartial.
Over the past 8 years of activity the company:
MAPS OF DEMAND ON JEWELRY (B2C MARKET) 2011, RUSSIA (VILLAGE)
1
Map of demand in the villages of Russia
2
Consumer expenses, $ per capita
3
Market Volume, $.
4
Map of demand in the villages of Central FD
5
Consumer expenses, $ per capita
6
Market Volume, $.
7
Map of demand in the villages of Northwest FD
8
Consumer expenses, $ per capita
9
Market Volume, $.
10
Map of demand in the villages of Volga FD
11
Consumer expenses, $ per capita
12
Market Volume, $.
13
Map of demand in the villages of Southern FD
14
Consumer expenses, $ per capita
15
Market Volume, $.
16
Map of demand in the villages of North Caucasus FD
17
Consumer expenses, $ per capita
18
Market Volume, $.
19
Map of demand in the villages of Urals FD
20
Consumer expenses, $ per capita
21
Market Volume, $.
22
Map of demand in the villages of Siberian FD
23
Consumer expenses, $ per capita
24
Market Volume, $.
25
Map of demand in the villages of Far East FD
26
Consumer expenses, $ per capita
27
Market Volume, $.
28
 Рынок изделий из драгоценных камней в России в 2020-2024 гг. и прогноз на 2025-2034 гг.
АМИКО Консалтинг Групп
58 000 ₽
 Анализ рынка серебряных ювелирных изделий в России в 2019-2023 гг, прогноз на 2024-2028 гг
BusinesStat
104 000 ₽
 Рынок ритейла в России: ювелирные изделия - 2023
AnalyticResearchGroup (ARG)
122 900 ₽
 Рынок ритейла в России: часы и ювелирные изделия - 2023
AnalyticResearchGroup (ARG)
122 900 ₽

Рынок стекловаты занимает значительную долю строительной теплоизоляции наряду с каменной ватой. Стекловата в большей степени используется в малоэтажном строительстве (ИЖС), поэтому данный рынок напрямую зависит от того, как развиваются перспективы загородного домостроения.
 Статья, 25 июля 2025
NeoAnalytics
Анализ российского рынка собственных торговых марок: итоги 2024 г., прогноз до 2028 г.
В мае 2025 года исследовательская компания NeoAnalytics завершила проведение маркетингового исследования российского рынка собственных торговых марок.
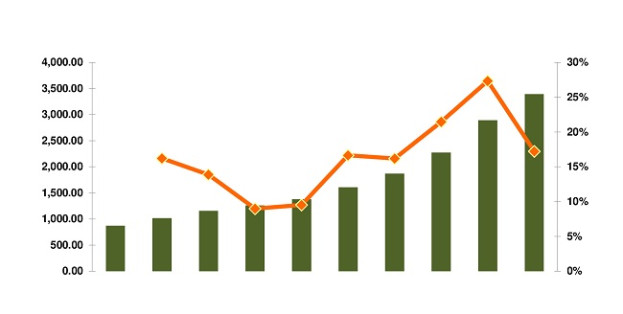
В ходе исследования, проведенного NeoAnalytics на тему «Российский рынок собственных торговых марок: итоги 2024 г., прогноз до 2028 г.», выяснилось, что по итогам 2024 г. объем российского рынка СТМ розничных сетей в стоимостном выражении увеличился на 17,2% по отношению к аналогичному показателю годом ранее. Для сравнения, еще в 2015 г. показатель объема рынка был зафиксирован на отметке в более чем 800 млрд. руб. Таким образом, рынок в 2024 г. вырос в 3,89 раз.
По данным компании «AnalyticResearchGroup», объем производства средств для маникюра и педикюра в России по итогам 2024 года составил 38,5 млн. шт. – это на 20,0% меньше, чем годом ранее и в 4,7 раза больше по сравнению с 2010 годом. В январе-феврале 2025 года объем выпуска был на уровне 5,6 млн. шт. По прогнозам, в 2025 году объем выпуска вырастет на 24,9%, до 48,1 млн. шт., а в 2029 году показатель достигнет значения 60,0 млн. шт.