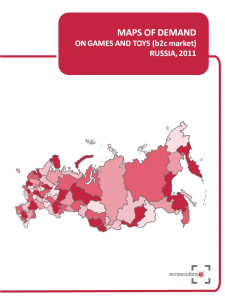


Map of demand on games and toys displays expenses per capita on purchased games and toys in rubles, $, €/RUB and market volume in amount of rub/$ in 2011.
Maps of demand by ‘Express-Obzor’ consist of 18 main slides (2 slides per each of 9 regional groups):
Map of demand on games and toys in Russia
Consumer expenses, $ per capita
Market Volume, $.
Map of demand on games and toys in Central FD
Consumer expenses, $ per capita
Market Volume, $.
Map of demand on games and toys in Northwest FD
Consumer expenses, $ per capita
Market Volume, $.
Map of demand on games and toys in Volga FD
Consumer expenses, $ per capita
Market Volume, $.
Map of demand on games and toys in Southern FD
Consumer expenses, $ per capita
Market Volume, $.
Map of demand on games and toys in North Caucasus FD
Consumer expenses, $ per capita
Market Volume, $.
Map of demand on games and toys in Urals FD
Consumer expenses, $ per capita
Market Volume, $.
Map of demand on games and toys in Siberian FD
Consumer expenses, $ per capita
Market Volume, $.
Map of demand on games and toys in Far East FD
Consumer expenses, $ per capita
Market Volume, $.
About the company
Company Express-Obzor since 2005 has been specializing in ready-made analytical market reports. Reports made my Express-Obzor’s specialists give an opportunity to receive basic information and a general idea of a market situation in a concise way. All assessments obtained in the course of a research are independent and impartial.
Over the past 8 years of activity the company:
MAPS OF DEMAND ON GAMES AND TOYS (B2C MARKET) IN RUSSIA, 2011
1
Map of demand in Russia
2
Consumer expenses, $ per capita
3
Market Volume, $.
4
Map of demand in Central FD
5
Consumer expenses, $ per capita
6
Market Volume, $.
7
Map of demand in Northwest FD
8
Consumer expenses, $ per capita
9
Market Volume, $.
10
Map of demand in Volga FD
11
Consumer expenses, $ per capita
12
Market Volume, $.
13
Map of demand in Southern FD
14
Consumer expenses, $ per capita
15
Market Volume, $.
16
Map of demand in North Caucasus FD
17
Consumer expenses, $ per capita
18
Market Volume, $.
19
Map of demand in Urals FD
20
Consumer expenses, $ per capita
21
Market Volume, $.
22
Map of demand in Siberian FD
23
Consumer expenses, $ per capita
24
Market Volume, $.
25
Map of demand in Far East FD
26
Consumer expenses, $ per capita
27
Market Volume, $.
28
 Анализ розничных цен на детские пластмассовые конструкторы 2024: динамика в рознице и инфляция 2009 – май 2024. Россия, федеральные округа, регионы
Экспресс-Обзор
55 000 ₽
 Анализ розничных цен на мягкие игрушки 2024: динамика в рознице и инфляция 2001 – апрель 2024. Россия, федеральные округа, регионы
Экспресс-Обзор
55 000 ₽
 Анализ розничных цен на пластмассовые игрушки для детей ясельного возраста 2024: динамика в рознице и инфляция 2000 – январь 2024. Россия, федеральные округа, регионы
Экспресс-Обзор
55 000 ₽
 Рынок ритейла в России: игры и игрушки - 2023
AnalyticResearchGroup (ARG)
122 900 ₽

 Статья, 5 февраля 2026
BusinesStat
Продажи свинины в России в 2021-2025 гг выросли на 16%: с 3,88 до 4,50 млн т.
В отличие от цен на птицу и другие виды мяса, цены на свинину достаточно стабильны.
По данным «Анализа рынка свинины в России», подготовленного BusinesStat в 2026 г, ее продажи в стране в 2021-2025 гг выросли на 16%: с 3,88 до 4,50 млн т.
 Статья, 5 февраля 2026
BusinesStat
Продажи хлеба и хлебобулочных изделий в России в 2025 г выросли на 1,5%: с 7,3 до 7,5 млн т.
Заметно растут продажи пирожков, пирогов и пончиков, удобных для перекуса "на ходу".
По данным «Анализа рынка хлеба и хлебобулочных изделий в России», подготовленного BusinesStat в 2026, их продажи в стране в 2025 г выросли на 1,5%: с 7,3 до 7,5 млн т.
 Статья, 4 февраля 2026
BusinesStat
В 2023-2025 гг в России производство диагностических реагентов для медицинских лабораторий выросло на 10% и достигло 126 млн упаковок.
Отечественные компании оперативно разрабатывают и выпускают реагенты для наукоемких направлений (генетика, онкология, гистология).
По данным "Анализа рынка диагностических реагентов в России", подготовленного BusinesStat в 2026 г, в 2023-2025 гг производство диагностических реагентов для медицинских лабораторий в стране выросло на 10% и составило 126 млн упаковок.