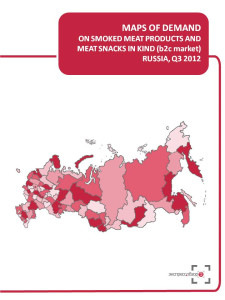
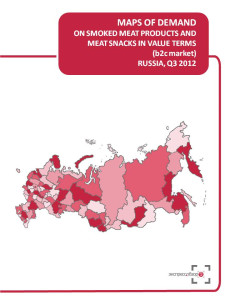
Map of demand on smoked meat products and meat snacks displays consumption of smoked meat products and meat snacks in kg, and market volume in amount of tonnes in Q3 2012.
Maps of demand by ‘Express-Obzor’ consist of 18 main slides (2 slides per each of 9 regional groups):
Map of demand on smoked meat products and meat snacks in Russia
Consumption, kg per capita
Market Volume, tonnes.
Map of demand on smoked meat products and meat snacks in Central FD
Consumption, kg per capita
Market Volume, tonnes.
Map of demand on smoked meat products and meat snacks in Northwest FD
Consumption, kg per capita
Market Volume, tonnes.
Map of demand on smoked meat products and meat snacks in Volga FD
Consumption, kg per capita
Market Volume, tonnes.
Map of demand on smoked meat products and meat snacks in Southern FD
Consumption, kg per capita
Market Volume, tonnes.
Map of demand on smoked meat products and meat snacks in North Caucasus FD
Consumption, kg per capita
Market Volume, tonnes.
Map of demand on smoked meat products and meat snacks in Urals FD
Consumption, kg per capita
Market Volume, tonnes.
Map of demand on smoked meat products and meat snacks in Siberian FD
Consumption, kg per capita
Market Volume, tonnes.
Map of demand on smoked meat products and meat snacks in Far East FD
Consumption, kg per capita
Market Volume, tonnes.
About the company
Company Express-Obzor since 2005 has been specializing in ready-made analytical market reports. Reports made my Express-Obzor’s specialists give an opportunity to receive basic information and a general idea of a market situation in a concise way. All assessments obtained in the course of a research are independent and impartial.
Over the past 7 years of activity the company:
- has gained a wide experience in analytical study and expert appraisal of various markets
- has published over 300 market surveys of nearly every economic sector
- has attended to more then 800 clients