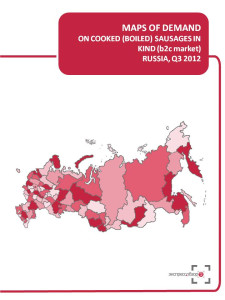


Map of demand on cooked (boiled) sausages displays consumption of cooked (boiled) sausages in kg, and market volume in amount of tonnes in Q3 2012.
Maps of demand by ‘Express-Obzor’ consist of 18 main slides (2 slides per each of 9 regional groups):
Map of demand on cooked (boiled) sausages in Russia
Consumption, kg per capita
Market Volume, tonnes.
Map of demand on cooked (boiled) sausages in Central FD
Consumption, kg per capita
Market Volume, tonnes.
Map of demand on cooked (boiled) sausages in Northwest FD
Consumption, kg per capita
Market Volume, tonnes.
Map of demand on cooked (boiled) sausages in Volga FD
Consumption, kg per capita
Market Volume, tonnes.
Map of demand on cooked (boiled) sausages in Southern FD
Consumption, kg per capita
Market Volume, tonnes.
Map of demand on cooked (boiled) sausages in North Caucasus FD
Consumption, kg per capita
Market Volume, tonnes.
Map of demand on cooked (boiled) sausages in Urals FD
Consumption, kg per capita
Market Volume, tonnes.
Map of demand on cooked (boiled) sausages in Siberian FD
Consumption, kg per capita
Market Volume, tonnes.
Map of demand on cooked (boiled) sausages in Far East FD
Consumption, kg per capita
Market Volume, tonnes.
About the company
Company Express-Obzor since 2005 has been specializing in ready-made analytical market reports. Reports made my Express-Obzor’s specialists give an opportunity to receive basic information and a general idea of a market situation in a concise way. All assessments obtained in the course of a research are independent and impartial.
Over the past 7 years of activity the company:
MAPS OF DEMAND ON COOKED (BOILED) SAUSAGES (B2C MARKET) IN RUSSIA, Q3 2012
1
Map of demand in Russia
2
Consumption, kg per capita
3
Market Volume, tonnes.
4
Map of demand in Central FD
5
Consumption, kg per capita
6
Market Volume, tonnes.
7
Map of demand in Northwest FD
8
Consumption, kg per capita
9
Market Volume, tonnes.
10
Map of demand in Volga FD
11
Consumption, kg per capita
12
Market Volume, tonnes.
13
Map of demand in Southern FD
14
Consumption, kg per capita
15
Market Volume, tonnes.
16
Map of demand in North Caucasus FD
17
Consumption, kg per capita
18
Market Volume, tonnes.
19
Map of demand in Urals FD
20
Consumption, kg per capita
21
Market Volume, tonnes.
22
Map of demand in Siberian FD
23
Consumption, kg per capita
24
Market Volume, tonnes.
25
Map of demand in Far East FD
26
Consumption, kg per capita
27
Market Volume, tonnes.
28
 Маркетинговое исследование рынка изделий колбасных вареных в России 2016-2022 гг. Прогноз на 2022-2026 гг. Август 2022.
ТК Солюшнс
95 900 ₽
 Маркетинговое исследование рынка вареной колбасы в Москве и Московской области 2014-2018 гг., прогноз до 2023 г.(с обновлением)
Компания Гидмаркет
199 000 ₽
 Рынок вареных колбас 2016: анализ спроса в России и регионах
Экспресс-Обзор
55 000 ₽
 Маркетинговое исследование рынка вареной колбасы в России 2014-2018 гг., прогноз до 2023 г. (с обновлением)
Компания Гидмаркет
199 000 ₽

 Статья, 5 февраля 2026
BusinesStat
Продажи свинины в России в 2021-2025 гг выросли на 16%: с 3,88 до 4,50 млн т.
В отличие от цен на птицу и другие виды мяса, цены на свинину достаточно стабильны.
По данным «Анализа рынка свинины в России», подготовленного BusinesStat в 2026 г, ее продажи в стране в 2021-2025 гг выросли на 16%: с 3,88 до 4,50 млн т.
 Статья, 5 февраля 2026
BusinesStat
Продажи хлеба и хлебобулочных изделий в России в 2025 г выросли на 1,5%: с 7,3 до 7,5 млн т.
Заметно растут продажи пирожков, пирогов и пончиков, удобных для перекуса "на ходу".
По данным «Анализа рынка хлеба и хлебобулочных изделий в России», подготовленного BusinesStat в 2026, их продажи в стране в 2025 г выросли на 1,5%: с 7,3 до 7,5 млн т.
 Статья, 4 февраля 2026
BusinesStat
В 2023-2025 гг в России производство диагностических реагентов для медицинских лабораторий выросло на 10% и достигло 126 млн упаковок.
Отечественные компании оперативно разрабатывают и выпускают реагенты для наукоемких направлений (генетика, онкология, гистология).
По данным "Анализа рынка диагностических реагентов в России", подготовленного BusinesStat в 2026 г, в 2023-2025 гг производство диагностических реагентов для медицинских лабораторий в стране выросло на 10% и составило 126 млн упаковок.