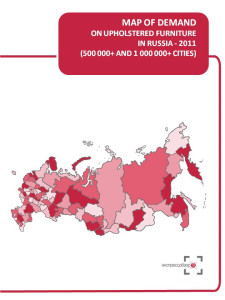


For your convenience we selected regions (subjects of RF) where located cities with population over 500 thousand residents. Map of demand is based on the statistics of these regions. Map of demand on upholstered furniture displays expenditures per capita on purchased upholstered furniture in rubles, $, € and market volume in rub/$/€/ in 2011.
Maps of demand by ‘Express-Obzor’ consist of 18 main slides (2 slides per each of 9 regional groups):
Map of demand on upholstered furniture in Russia
Map of demand on upholstered furniture in Central FD (regions where located cities with population over 500 thousand residents)
Map of demand on upholstered furniture in Northwest FD (regions where located cities with population over 500 thousand residents)
Map of demand on upholstered furniture in Volga FD (regions where located cities with population over 500 thousand residents)
Map of demand on upholstered furniture in Southern FD (regions where located cities with population over 500 thousand residents)
Map of demand on upholstered furniture in North Caucasus FD (regions where located cities with population over 500 thousand residents)
Map of demand on upholstered furniture in Urals FD (regions where located cities with population over 500 thousand residents)
Map of demand on upholstered furniture in Siberian FD (regions where located cities with population over 500 thousand residents)
Map of demand on upholstered furniture in Far East FD (regions where located cities with population over 500 thousand residents)
About the company
Company Express-Obzor –since 2005 has been specializing in ready-made analytical market reports. Reports made my Express-Obzor’s specialists give an opportunity to receive basic information and a general idea of a market situation in a concise way. All assessments obtained in the course of a research are independent and impartial.
Over the past 7 years of activity the company:
has attended to more then 800 clients
MAP OF DEMAND ON UPHOLSTERED FURNITURE RUSSIA, 2011
1
Map of demand in Russia
2
Consumer expenditures, $/€/RUB per capita
3
Market Volume, $/€/RUB.
4
Map of demand in Central FD (regions where located cities with population over 500 thousand residents)
5
Consumer expenditures, $/€/RUB per capita
6
Market Volume, $/€/RUB.
7
Map of demand in Northwest FD (regions where located cities with population over 500 thousand residents)
8
Consumer expenditures, $/€/RUB per capita
9
Market Volume, $/€/RUB.
10
Map of demand in Volga FD (regions where located cities with population over 500 thousand residents)
11
Consumer expenditures, $/€/RUB per capita
12
Market Volume, $/€/RUB.
13
Map of demand in Southern FD (regions where located cities with population over 500 thousand residents)
14
Consumer expenditures, $/€/RUB per capita
15
Market Volume, $/€/RUB.
16
Map of demand in North Caucasus FD (regions where located cities with population over 500 thousand residents)
17
Consumer expenditures, $/€/RUB per capita
18
Market Volume, $/€/RUB.
19
Map of demand in Urals FD (regions where located cities with population over 500 thousand residents)
20
Consumer expenditures, $/€/RUB per capita
21
Market Volume, $/€/RUB.
22
Map of demand in Siberian FD (regions where located cities with population over 500 thousand residents)
23
Consumer expenditures, $/€/RUB per capita
24
Market Volume, $/€/RUB.
25
Map of demand in Far East FD (regions where located cities with population over 500 thousand residents)
26
Consumer expenditures, $/€/RUB per capita
27
Market Volume, $/€/RUB.
28
 Мебельный ретейл России 2024.Статистика, тренды и прогнозы
РБК Исследования рынков
Бесплатно
 Pro-новости рынка мебели
РБК Исследования рынков
Бесплатно
 Маркетинговое исследование рынка мягкой мебели в России 2017-2021 гг., прогноз до 2026 г. (с обновлением)
Компания Гидмаркет
99 000 ₽
 Рынок диванов в России - 2020. Показатели и прогнозы
TEBIZ GROUP
89 900 ₽

 Статья, 17 июля 2025
BusinesStat
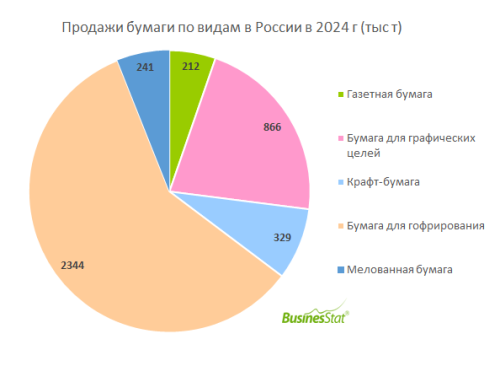
За 2020-2024 гг продажи бумаги в России увеличились на 7%: с 4,1 до 4,3 млн т.
Рынок растет за счет сегментов бумаги для гофрирования и крафт-бумаги.
По данным «Анализа рынка бумаги в России», подготовленного BusinesStat в 2025 г, за 2020-2024 гг ее продажи в стране увеличились на 7%: с 4,1 до 4,3 млн т. Наибольшую долю в структуре продаж занимает бумага для гофрирования, используемая преимущественно при производстве гофрированного картона. Бумага для гофрирования и крафт-бумага являются основным растущим сегментами рынка.
 Статья, 17 июля 2025
BusinesStat
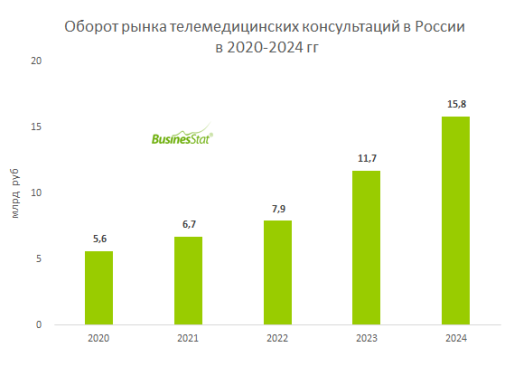
За 2020-2024 гг в России выручка клиник от дистанционных врачебных консультаций выросла в 3 раза: с 5,6 до 15,8 млрд руб.
Пациенты оценили удобство онлайн-консультаций по полисам ДМС.
По данным «Анализа рынка телемедицины в России», подготовленного BusinesStat в 2025 г, за 2020-2024 гг в стране выручка клиник от дистанционных врачебных консультаций выросла в 3 раза: с 5,6 до 15,8 млрд руб. Рост обеспечивался как за счет увеличения количества консультаций, так и в результате повышения средней цены. В 2023-2024 гг телемедицина активно применялась в полисах ДМС. Страховщики увеличили количество дистанционных консультаций в корпоративных программах, что поддержало спрос на телемедицину со стороны физлиц. Пациенты оценили удобство онлайн-консультаций по полисам ДМС и готовы самостоятельно оплачивать телемедицинские услуги для себя и своих близких независимо от работодателя. Развитию рынка способствовал также экспериментальный правовой режим, установленный в августе 2023 г. В результате, врачи получили возможность корректировать лечение и диагноз, выписывать рецепты посредством дистанционных технологий.
Интерес к порошковым покрытиям в последние 10 лет сильно возрос как на мировом рынке, так и на российском. Несмотря на многие преимущества порошковых ЛКМ по сравнению с жидкими (технические, экономические, экологические), их доля в общем объеме производства лакокрасочной продукции в среднем в мире не превышает 10%, а в России — ~5% (для сравнения: в странах ЕС этот показатель достигает 15-18%). В период 2021-2022 гг. рынок порошковых красок демонстрировал положительную динамику. В 2024 г. имело место снижение на уровне 2,5-3% в тоннаже.