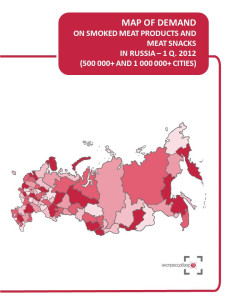


For your convenience we selected regions (subjects of RF) where located cities with population over 500 thousand residents. Map of demand is based on the statistics of these regions. Map of demand on smoked meat products and meat snacks displays expenditures per capita on purchased smoked meat products and meat snacks in rubles, $, € and market volume in rub/$/€/ in 1 Q. 2012
Maps of demand by ‘Express-Obzor’ consist of 18 main slides (2 slides per each of 9 regional groups):
Map of demand on smoked meat products and meat snacks in Russia
Map of demand on smoked meat products and meat snacks in Central FD (regions where located cities with population over 500 thousand residents)
Map of demand on smoked meat products and meat snacks in Northwest FD (regions where located cities with population over 500 thousand residents)
Map of demand on smoked meat products and meat snacks in Volga FD (regions where located cities with population over 500 thousand residents)
Map of demand on smoked meat products and meat snacks in Southern FD (regions where located cities with population over 500 thousand residents)
Map of demand on smoked meat products and meat snacks in North Caucasus FD (regions where located cities with population over 500 thousand residents)
Map of demand on smoked meat products and meat snacks in Urals FD (regions where located cities with population over 500 thousand residents)
Map of demand on smoked meat products and meat snacks in Siberian FD (regions where located cities with population over 500 thousand residents)
Map of demand on smoked meat products and meat snacks in Far East FD (regions where located cities with population over 500 thousand residents)
About the company
Company Express-Obzor –since 2005 has been specializing in ready-made analytical market reports. Reports made my Express-Obzor’s specialists give an opportunity to receive basic information and a general idea of a market situation in a concise way. All assessments obtained in the course of a research are independent and impartial.
Over the past 7 years of activity the company:
MAP OF DEMAND ON SMOKED MEAT PRODUCTS AND MEAT SNACKS RUSSIA, 1 Q. 2012
1
Map of demand in Russia
2
Consumer expenditures, $/€/RUB per capita
3
Market Volume, $/€/RUB.
4
Map of demand in Central FD (regions where located cities with population over 500 thousand residents)
5
Consumer expenditures, $/€/RUB per capita
6
Market Volume, $/€/RUB.
7
Map of demand in Northwest FD (regions where located cities with population over 500 thousand residents)
8
Consumer expenditures, $/€/RUB per capita
9
Market Volume, $/€/RUB.
10
Map of demand in Volga FD (regions where located cities with population over 500 thousand residents)
11
Consumer expenditures, $/€/RUB per capita
12
Market Volume, $/€/RUB.
13
Map of demand in Southern FD (regions where located cities with population over 500 thousand residents)
14
Consumer expenditures, $/€/RUB per capita
15
Market Volume, $/€/RUB.
16
Map of demand in North Caucasus FD (regions where located cities with population over 500 thousand residents)
17
Consumer expenditures, $/€/RUB per capita
18
Market Volume, $/€/RUB.
19
Map of demand in Urals FD (regions where located cities with population over 500 thousand residents)
20
Consumer expenditures, $/€/RUB per capita
21
Market Volume, $/€/RUB.
22
Map of demand in Siberian FD (regions where located cities with population over 500 thousand residents)
23
Consumer expenditures, $/€/RUB per capita
24
Market Volume, $/€/RUB.
25
Map of demand in Far East FD (regions where located cities with population over 500 thousand residents)
26
Consumer expenditures, $/€/RUB per capita
27
Market Volume, $/€/RUB.
28
 Анализ розничных цен на вареную колбасу 2024: динамика в рознице и инфляция 2014 – май 2024. Россия, федеральные округа, регионы
Экспресс-Обзор
55 000 ₽
 Цены на сырокопченые колбасы 2024: динамика в рознице и инфляция 2000 – январь 2024. Россия, федеральные округа, регионы
Экспресс-Обзор
55 000 ₽
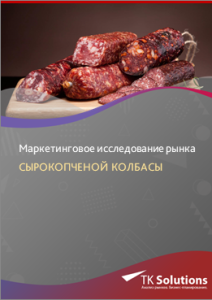 Маркетинговое исследование рынка сырокопченой колбасы в России 2016-2022 гг. Прогноз на 2022-2026 гг. Август 2022.
ТК Солюшнс
95 900 ₽
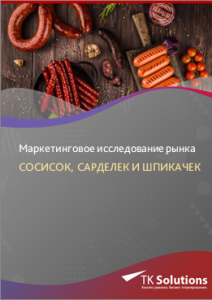 Маркетинговое исследование рынка сосисок, сарделек и шпикачек в России 2016-2022 гг. Прогноз на 2022-2026 гг. Август 2022.
ТК Солюшнс
95 900 ₽

 Статья, 18 февраля 2026
BusinesStat
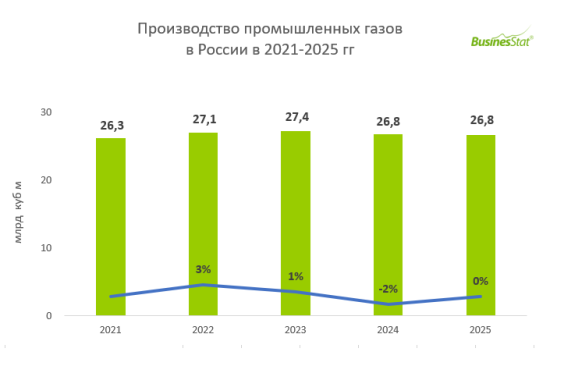
В 2025 г производство промышленных газов в России составило 26,8 млрд кубометров, что соответствовало уровню 2024 г.
Стабилизация производства связана во многом связана со снижением внутризаводских потребностей в техническом водороде.
По данным «Анализа рынка промышленных газов в России», подготовленного BusinesStat в 2026 г, в 2025 г их производство в стране составило 26,8 млрд кубометров, что соответствовало уровню 2024 г. Такая динамика обусловлена сокращением выпуска водорода и азота. Это связано с оптимизацией запасов продукции и производственных мощностей, корректировкой спроса на азот со стороны отраслей-потребителей, снижением внутризаводских потребностей в техническом водороде.
 Статья, 18 февраля 2026
SYNOPSIS consulting&research
В 2025 г объем платных социальных услуг увеличился на 14,9%
в 2025 г. объем платных социальных услуг в РФ составил 62,6 млрд руб.
По данным Бизнес-плана Пансионата для пожилых с медицинскими услугами, разработанного SYNOPSIS, в 2025 г. объем платных социальных услуг (предоставляемых гражданам пожилого возраста и инвалидам) в РФ составил 62,6 млрд руб., что на 14,9 % больше, чем годом ранее.
 Статья, 17 февраля 2026
BusinesStat
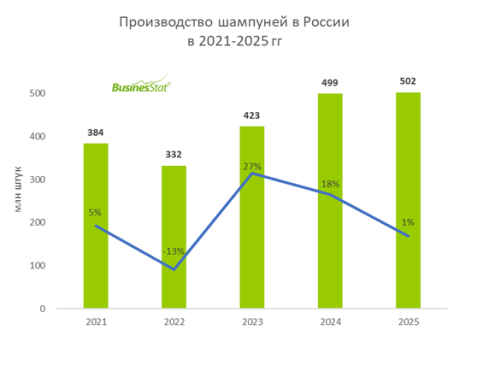
За 2023-2025 гг производство шампуней в России увеличилось в 1,5 раза и достигло 502 млн шт.
Росту производства способствует активное импортозамещение на фоне ухода западных брендов и господдержки отечественных производителей.
По данным «Анализа рынка шампуней в России», подготовленного BusinesStat в 2026 г, за 2023-2025 гг их производство в стране увеличилось в 1,5 раза относительно 2022 г и к концу периода достигло 502 млн шт.