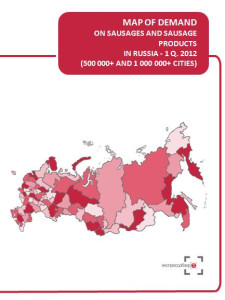


Maps of demand by ‘Express-Obzor’ consist of 18 main slides (2 slides per each of 9 regional groups):
Map of demand on sausages and sausage products in RussiaConsumer expenditures, $/€/RUB per capita
Market Volume, $/€/RUB.
Map of demand on sausages and sausage products in Central FD (regions where located cities with population over 500 thousand residents)Consumer expenditures, $/€/RUB per capita
Market Volume, $/€/RUB.
Map of demand on sausages and sausage products in Northwest FD (regions where located cities with population over 500 thousand residents)Consumer expenditures, $/€/RUB per capita
Market Volume, $/€/RUB.
Map of demand on sausages and sausage products in Volga FD (regions where located cities with population over 500 thousand residents)Consumer expenditures, $/€/RUB per capita
Market Volume, $/€/RUB.
Map of demand on sausages and sausage products in Southern FD (regions where located cities with population over 500 thousand residents)Consumer expenditures, $/€/RUB per capita
Market Volume, $/€/RUB.
Map of demand on sausages and sausage products in North Caucasus FD (regions where located cities with population over 500 thousand residents)Consumer expenditures, $/€/RUB per capita
Market Volume, $/€/RUB.
Map of demand on sausages and sausage products in Urals FD (regions where located cities with population over 500 thousand residents)Consumer expenditures, $/€/RUB per capita
Market Volume, $/€/RUB.
Map of demand on sausages and sausage products in Siberian FD (regions where located cities with population over 500 thousand residents)Consumer expenditures, $/€/RUB per capita
Market Volume, $/€/RUB.
Map of demand on sausages and sausage products in Far East FD (regions where located cities with population over 500 thousand residents)Consumer expenditures, $/€/RUB per capita
Market Volume, $/€/RUB.
About the company
Company Express-Obzor –since 2005 has been specializing in ready-made analytical market reports. Reports made my Express-Obzor’s specialists give an opportunity to receive basic information and a general idea of a market situation in a concise way. All assessments obtained in the course of a research are independent and impartial.
Over the past 7 years of activity the company:
MAP OF DEMAND ON SAUSAGES AND SAUSAGE PRODUCTS RUSSIA, 1 q. 2012
1
Map of demand in Russia
2
Consumer expenditures, $/€/RUB per capita
3
Market Volume, $/€/RUB.
4
Map of demand in Central FD (regions where located cities with population over 500 thousand residents)
5
Consumer expenditures, $/€/RUB per capita
6
Market Volume, $/€/RUB.
7
Map of demand in Northwest FD (regions where located cities with population over 500 thousand residents)
8
Consumer expenditures, $/€/RUB per capita
9
Market Volume, $/€/RUB.
10
Map of demand in Volga FD (regions where located cities with population over 500 thousand residents)
11
Consumer expenditures, $/€/RUB per capita
12
Market Volume, $/€/RUB.
13
Map of demand in Southern FD (regions where located cities with population over 500 thousand residents)
14
Consumer expenditures, $/€/RUB per capita
15
Market Volume, $/€/RUB.
16
Map of demand in North Caucasus FD (regions where located cities with population over 500 thousand residents)
17
Consumer expenditures, $/€/RUB per capita
18
Market Volume, $/€/RUB.
19
Map of demand in Urals FD (regions where located cities with population over 500 thousand residents)
20
Consumer expenditures, $/€/RUB per capita
21
Market Volume, $/€/RUB.
22
Map of demand in Siberian FD (regions where located cities with population over 500 thousand residents)
23
Consumer expenditures, $/€/RUB per capita
24
Market Volume, $/€/RUB.
25
Map of demand in Far East FD (regions where located cities with population over 500 thousand residents)
26
Consumer expenditures, $/€/RUB per capita
27
Market Volume, $/€/RUB.
28
 Анализ розничных цен на вареную колбасу 2024: динамика в рознице и инфляция 2014 – май 2024. Россия, федеральные округа, регионы
Экспресс-Обзор
45 000 ₽
 Цены на сырокопченые колбасы 2024: динамика в рознице и инфляция 2000 – январь 2024. Россия, федеральные округа, регионы
Экспресс-Обзор
45 000 ₽
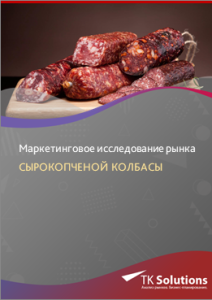 Маркетинговое исследование рынка сырокопченой колбасы в России 2016-2022 гг. Прогноз на 2022-2026 гг. Август 2022.
ТК Солюшнс
85 900 ₽
 Маркетинговое исследование рынка сосисок, сарделек и шпикачек в России 2016-2022 гг. Прогноз на 2022-2026 гг. Август 2022.
ТК Солюшнс
85 900 ₽

 Статья, 26 июля 2024
BusinesStat
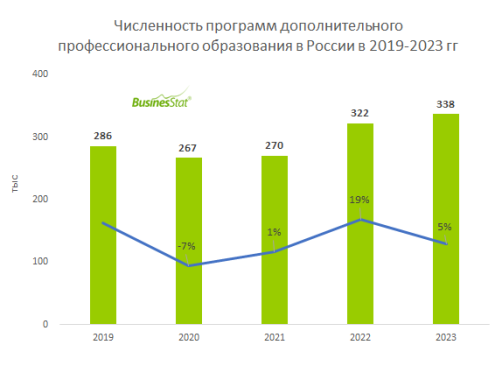
За 2021-2023 гг количество программ дополнительного профессионального образования в России увеличилось на 27% и достигло 338 тыс.
Особенно востребованным становится ИТ-направление.
По данным «Анализа рынка дополнительного профессионального образования в России», подготовленного BusinesStat в 2024 г, за 2021-2023 гг количество программ дополнительного профессионального образования в стране увеличилось на 27% и достигло 338 тыс. После временного спада в 2020 г образовательные организации вновь увеличили предложение учебных программ в ответ на потребности бизнеса и государства.
 Статья, 26 июля 2024
BusinesStat
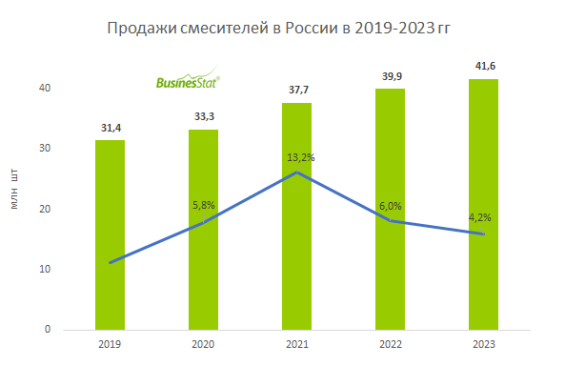
В 2023 г продажи смесителей в России увеличились на 4,2% и составили 41,6 млн шт.
Продажи смесителей поддержало увеличение поставок продукции эконом-сегмента из Китая.
По данным «Анализа рынка смесителей в России», подготовленного BusinesStat в 2024 г, в 2023 г их продажи в стране увеличились на 4,2% и составили 41,6 млн шт. В течение последних лет продажи ежегодно росли, главным драйвером продаж были рекордные объемы ввода в эксплуатацию новых зданий и выданных льготных ипотечных кредитов, которые стимулировали спрос в отраслях, смежных со строительством.
 Статья, 26 июля 2024
BusinesStat
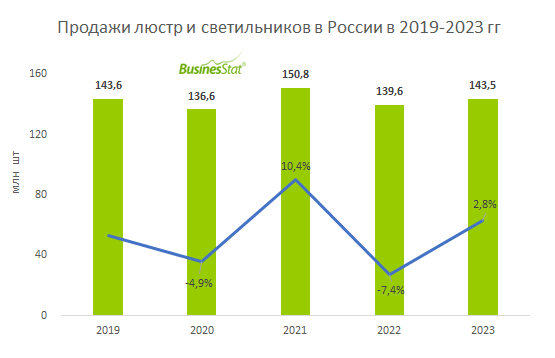
В 2023 г продажи люстр и светильников в России выросли на 3% и составили 144 млн шт.
После ухода иностранных брендов отечественные компании смогли занять освободившиеся ниши.
По данным "Анализа рынка люстр и светильников в России", подготовленного BusinesStat в 2024 г, в 2023 г их продажи в стране выросли на 3% и составили 144 млн шт.