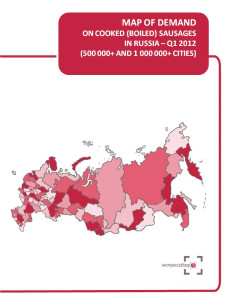


For your convenience we selected regions (subjects of RF) where located cities with population over 500 thousand residents. Map of demand is based on the statistics of these regions. Map of demand on cooked (boiled) sausages displays expenditures per capita on purchased cooked (boiled) sausages in rubles, $, € and market volume in rub/$/€/ in Q1 2012.
Maps of demand by ‘Express-Obzor’ consist of 18 main slides (2 slides per each of 9 regional groups):
Map of demand on cooked (boiled) sausages in Russia
Map of demand on cooked (boiled) sausages in Central FD (regions where located cities with population over 500 thousand residents)
Map of demand on cooked (boiled) sausages in Northwest FD (regions where located cities with population over 500 thousand residents)
Map of demand on cooked (boiled) sausages in Volga FD (regions where located cities with population over 500 thousand residents)
Map of demand on cooked (boiled) sausages in Southern FD (regions where located cities with population over 500 thousand residents)
Map of demand on cooked (boiled) sausages in North Caucasus FD (regions where located cities with population over 500 thousand residents)
Map of demand on cooked (boiled) sausages in Urals FD (regions where located cities with population over 500 thousand residents)
Map of demand on cooked (boiled) sausages in Siberian FD (regions where located cities with population over 500 thousand residents)
Map of demand on cooked (boiled) sausages in Far East FD (regions where located cities with population over 500 thousand residents)
About the company
Company Express-Obzor –since 2005 has been specializing in ready-made analytical market reports. Reports made my Express-Obzor’s specialists give an opportunity to receive basic information and a general idea of a market situation in a concise way. All assessments obtained in the course of a research are independent and impartial.
Over the past 7 years of activity the company:
MAP OF DEMAND ON COOKED (BOILED) SAUSAGES RUSSIA, Q1 2012
1
Map of demand in Russia
2
Consumer expenditures, $/€/RUB per capita
3
Market Volume, $/€/RUB.
4
Map of demand in Central FD (regions where located cities with population over 500 thousand residents)
5
Consumer expenditures, $/€/RUB per capita
6
Market Volume, $/€/RUB.
7
Map of demand in Northwest FD (regions where located cities with population over 500 thousand residents)
8
Consumer expenditures, $/€/RUB per capita
9
Market Volume, $/€/RUB.
10
Map of demand in Volga FD (regions where located cities with population over 500 thousand residents)
11
Consumer expenditures, $/€/RUB per capita
12
Market Volume, $/€/RUB.
13
Map of demand in Southern FD (regions where located cities with population over 500 thousand residents)
14
Consumer expenditures, $/€/RUB per capita
15
Market Volume, $/€/RUB.
16
Map of demand in North Caucasus FD (regions where located cities with population over 500 thousand residents)
17
Consumer expenditures, $/€/RUB per capita
18
Market Volume, $/€/RUB.
19
Map of demand in Urals FD (regions where located cities with population over 500 thousand residents)
20
Consumer expenditures, $/€/RUB per capita
21
Market Volume, $/€/RUB.
22
Map of demand in Siberian FD (regions where located cities with population over 500 thousand residents)
23
Consumer expenditures, $/€/RUB per capita
24
Market Volume, $/€/RUB.
25
Map of demand in Far East FD (regions where located cities with population over 500 thousand residents)
26
Consumer expenditures, $/€/RUB per capita
27
Market Volume, $/€/RUB.
28
 Маркетинговое исследование рынка изделий колбасных вареных в России 2016-2022 гг. Прогноз на 2022-2026 гг. Август 2022.
ТК Солюшнс
85 900 ₽
 Маркетинговое исследование рынка вареной колбасы в Москве и Московской области 2014-2018 гг., прогноз до 2023 г.(с обновлением)
Компания Гидмаркет
99 000 ₽
 Рынок вареных колбас 2016: анализ спроса в России и регионах
Экспресс-Обзор
55 000 ₽
 Маркетинговое исследование рынка вареной колбасы в России 2014-2018 гг., прогноз до 2023 г. (с обновлением)
Компания Гидмаркет
99 000 ₽

 Статья, 26 июля 2024
BusinesStat
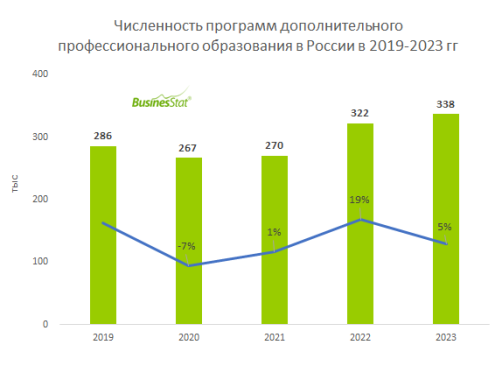
За 2021-2023 гг количество программ дополнительного профессионального образования в России увеличилось на 27% и достигло 338 тыс.
Особенно востребованным становится ИТ-направление.
По данным «Анализа рынка дополнительного профессионального образования в России», подготовленного BusinesStat в 2024 г, за 2021-2023 гг количество программ дополнительного профессионального образования в стране увеличилось на 27% и достигло 338 тыс. После временного спада в 2020 г образовательные организации вновь увеличили предложение учебных программ в ответ на потребности бизнеса и государства.
 Статья, 26 июля 2024
BusinesStat
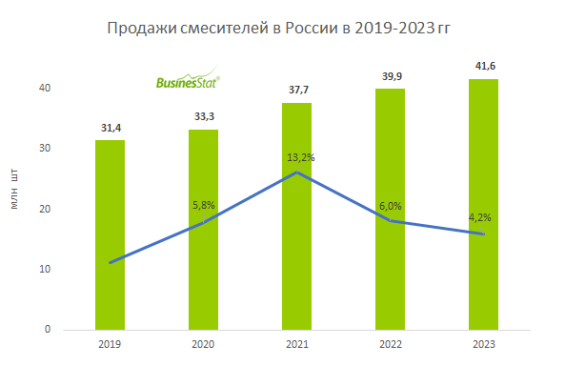
В 2023 г продажи смесителей в России увеличились на 4,2% и составили 41,6 млн шт.
Продажи смесителей поддержало увеличение поставок продукции эконом-сегмента из Китая.
По данным «Анализа рынка смесителей в России», подготовленного BusinesStat в 2024 г, в 2023 г их продажи в стране увеличились на 4,2% и составили 41,6 млн шт. В течение последних лет продажи ежегодно росли, главным драйвером продаж были рекордные объемы ввода в эксплуатацию новых зданий и выданных льготных ипотечных кредитов, которые стимулировали спрос в отраслях, смежных со строительством.
 Статья, 26 июля 2024
BusinesStat
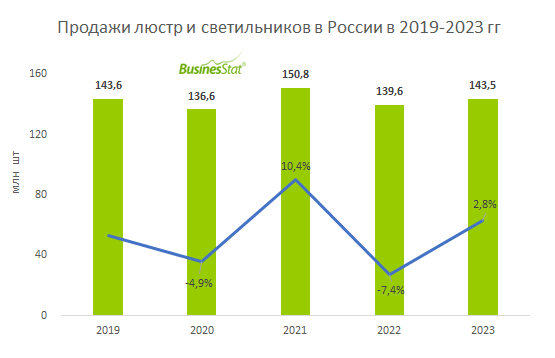
В 2023 г продажи люстр и светильников в России выросли на 3% и составили 144 млн шт.
После ухода иностранных брендов отечественные компании смогли занять освободившиеся ниши.
По данным "Анализа рынка люстр и светильников в России", подготовленного BusinesStat в 2024 г, в 2023 г их продажи в стране выросли на 3% и составили 144 млн шт.