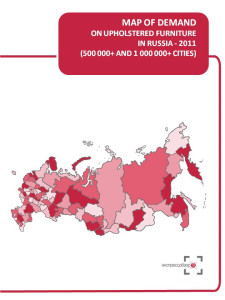


For your convenience we selected regions (subjects of RF) where located cities with population over 500 thousand residents. Map of demand is based on the statistics of these regions. Map of demand on upholstered furniture displays expenditures per capita on purchased upholstered furniture in rubles, $, € and market volume in rub/$/€/ in 2011.
Maps of demand by ‘Express-Obzor’ consist of 18 main slides (2 slides per each of 9 regional groups):
Map of demand on upholstered furniture in Russia
Map of demand on upholstered furniture in Central FD (regions where located cities with population over 500 thousand residents)
Map of demand on upholstered furniture in Northwest FD (regions where located cities with population over 500 thousand residents)
Map of demand on upholstered furniture in Volga FD (regions where located cities with population over 500 thousand residents)
Map of demand on upholstered furniture in Southern FD (regions where located cities with population over 500 thousand residents)
Map of demand on upholstered furniture in North Caucasus FD (regions where located cities with population over 500 thousand residents)
Map of demand on upholstered furniture in Urals FD (regions where located cities with population over 500 thousand residents)
Map of demand on upholstered furniture in Siberian FD (regions where located cities with population over 500 thousand residents)
Map of demand on upholstered furniture in Far East FD (regions where located cities with population over 500 thousand residents)
About the company
Company Express-Obzor –since 2005 has been specializing in ready-made analytical market reports. Reports made my Express-Obzor’s specialists give an opportunity to receive basic information and a general idea of a market situation in a concise way. All assessments obtained in the course of a research are independent and impartial.
Over the past 7 years of activity the company:
has attended to more then 800 clients
MAP OF DEMAND ON UPHOLSTERED FURNITURE RUSSIA, 2011
1
Map of demand in Russia
2
Consumer expenditures, $/€/RUB per capita
3
Market Volume, $/€/RUB.
4
Map of demand in Central FD (regions where located cities with population over 500 thousand residents)
5
Consumer expenditures, $/€/RUB per capita
6
Market Volume, $/€/RUB.
7
Map of demand in Northwest FD (regions where located cities with population over 500 thousand residents)
8
Consumer expenditures, $/€/RUB per capita
9
Market Volume, $/€/RUB.
10
Map of demand in Volga FD (regions where located cities with population over 500 thousand residents)
11
Consumer expenditures, $/€/RUB per capita
12
Market Volume, $/€/RUB.
13
Map of demand in Southern FD (regions where located cities with population over 500 thousand residents)
14
Consumer expenditures, $/€/RUB per capita
15
Market Volume, $/€/RUB.
16
Map of demand in North Caucasus FD (regions where located cities with population over 500 thousand residents)
17
Consumer expenditures, $/€/RUB per capita
18
Market Volume, $/€/RUB.
19
Map of demand in Urals FD (regions where located cities with population over 500 thousand residents)
20
Consumer expenditures, $/€/RUB per capita
21
Market Volume, $/€/RUB.
22
Map of demand in Siberian FD (regions where located cities with population over 500 thousand residents)
23
Consumer expenditures, $/€/RUB per capita
24
Market Volume, $/€/RUB.
25
Map of demand in Far East FD (regions where located cities with population over 500 thousand residents)
26
Consumer expenditures, $/€/RUB per capita
27
Market Volume, $/€/RUB.
28
 Мебельный ретейл России 2024.Статистика, тренды и прогнозы
РБК Исследования рынков
Бесплатно
 Pro-новости рынка мебели
РБК Исследования рынков
Бесплатно
 Маркетинговое исследование рынка мягкой мебели в России 2017-2021 гг., прогноз до 2026 г. (с обновлением)
Компания Гидмаркет
99 000 ₽
 Рынок диванов в России - 2020. Показатели и прогнозы
TEBIZ GROUP
89 900 ₽

 Статья, 30 мая 2025
Компания Гидмаркет
Рынок изделий народного промысла в России вырос до 22,7 млрд рублей
Кто и зачем покупает русские сувениры: от туристов до госструктур
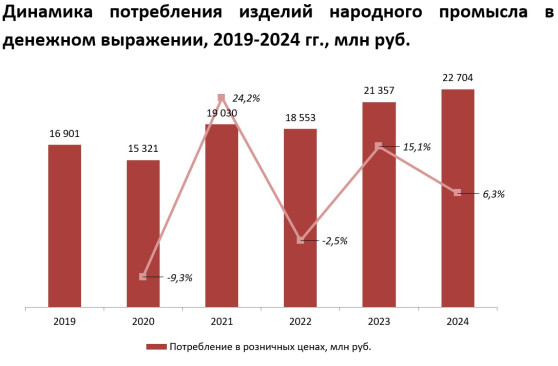
По данным «ГидМаркет», в 2024 году объём потребления изделий народных художественных промыслов в России составил 22,7 млрд рублей, что на 6,3% выше уровня 2022 года. Рост обеспечен как внутренним, так и внешним спросом, несмотря на турбулентность в экономике и туризме.
 Статья, 30 мая 2025
BusinesStat
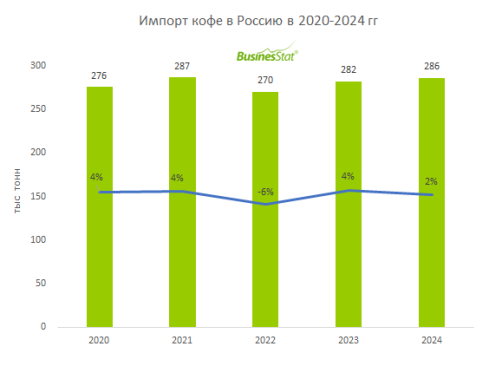
Импорт кофе в Россию в 2020-2024 гг возрос на 4%: с 276 до 286 тыс т.
В основном растет импорт зеленого кофе, который служит сырьем для обжарки.
По данным «Анализа рынка кофе в России», подготовленного BusinesStat в 2025 г, его импорт в страну в 2020-2024 гг возрос на 4%: с 276 до 286 тыс т, благодаря увеличению внутреннего спроса. При этом увеличивался в основном импорт зеленого кофе, который служит сырьем для производства кофе для конечного потребителя внутри страны при относительной стабильности импорта кофе, готового к продаже.
 Статья, 30 мая 2025
BusinesStat
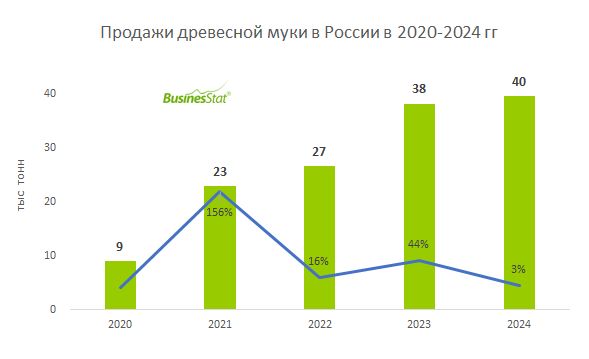
В 2020-2024 гг продажи древесной муки в России выросли более, чем в 4 раза: с 9 до 40 тыс т.
Рост спроса обеспечивается низкой себестоимостью и экологичностью материала.
По данным «Анализа рынка древесной муки в России», подготовленного BusinesStat в 2025 г, в 2020-2024 гг ее продажи в стране выросли более, чем в 4 раза: с 9 до 40 тыс т.