For your convenience we selected regions (subjects of RF) where located cities with population over 500 thousand residents. Map of demand is based on the statistics of these regions. Map of demand on cooked smoked and half-smoked sausages displays expenditures per capita on purchased cooked smoked and half-smoked sausages in rubles, $, € and market volume in rub/$/€/ in Q1 2012.
Maps of demand by ‘Express-Obzor’ consist of 18 main slides (2 slides per each of 9 regional groups):
Map of demand on cooked smoked and half-smoked sausages in Russia
Map of demand on cooked smoked and half-smoked sausages in Central FD (regions where located cities with population over 500 thousand residents)
Map of demand on cooked smoked and half-smoked sausages in Northwest FD (regions where located cities with population over 500 thousand residents)
Map of demand on cooked smoked and half-smoked sausages in Volga FD (regions where located cities with population over 500 thousand residents)
Map of demand on cooked smoked and half-smoked sausages in Southern FD (regions where located cities with population over 500 thousand residents)
Map of demand on cooked smoked and half-smoked sausages in North Caucasus FD (regions where located cities with population over 500 thousand residents)
Map of demand on cooked smoked and half-smoked sausages in Urals FD (regions where located cities with population over 500 thousand residents)
Map of demand on cooked smoked and half-smoked sausages in Siberian FD (regions where located cities with population over 500 thousand residents)
Map of demand on cooked smoked and half-smoked sausages in Far East FD (regions where located cities with population over 500 thousand residents)
About the company
Company Express-Obzor –since 2005 has been specializing in ready-made analytical market reports. Reports made my Express-Obzor’s specialists give an opportunity to receive basic information and a general idea of a market situation in a concise way. All assessments obtained in the course of a research are independent and impartial.
Over the past 7 years of activity the company:
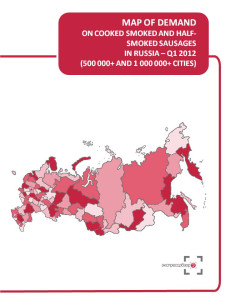
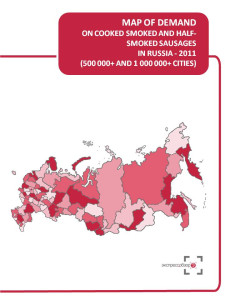
MAP OF DEMAND ON COOKED SMOKED AND HALF-SMOKED SAUSAGES RUSSIA, Q1 2012
Map of demand in Russia
Consumer expenditures, $/€/RUB per capita
Market Volume, $/€/RUB.
Map of demand in Central FD (regions where located cities with population over 500 thousand residents)
Consumer expenditures, $/€/RUB per capita
Market Volume, $/€/RUB.
Map of demand in Northwest FD (regions where located cities with population over 500 thousand residents)
Consumer expenditures, $/€/RUB per capita
Market Volume, $/€/RUB.
Map of demand in Volga FD (regions where located cities with population over 500 thousand residents)
Consumer expenditures, $/€/RUB per capita
Market Volume, $/€/RUB.
Map of demand in Southern FD (regions where located cities with population over 500 thousand residents)
Consumer expenditures, $/€/RUB per capita
Market Volume, $/€/RUB.
Map of demand in North Caucasus FD (regions where located cities with population over 500 thousand residents)
Consumer expenditures, $/€/RUB per capita
Market Volume, $/€/RUB.
Map of demand in Urals FD (regions where located cities with population over 500 thousand residents)
Consumer expenditures, $/€/RUB per capita
Market Volume, $/€/RUB.
Map of demand in Siberian FD (regions where located cities with population over 500 thousand residents)
Consumer expenditures, $/€/RUB per capita
Market Volume, $/€/RUB.
Map of demand in Far East FD (regions where located cities with population over 500 thousand residents)
Consumer expenditures, $/€/RUB per capita
Market Volume, $/€/RUB.
В 2022 году общая сумма услуг, предоставленных автосервисами населению в России, оценивалась в 465,2 миллиарда рублей, что на 17,9% превышает уровень предыдущего года. Показатель CAGR на этом рынке за период с 1994 года составил 27,5%.
По данным «Анализа рынка портативных компьютеров (ноутбуков и планшетов) в России», подготовленного BusinesStat в 2024 г, за 2022-2023 гг их продажи в стране снизились на 44% относительно 2021 г и составили 4,4 млн устройств.
По данным «Анализа рынка процессоров и контроллеров в России», подготовленного BusinesStat в 2024 г, в 2022-2023 гг их выпуск в стране снизился на 22% по отношению к 2021 г и составил 8,1 млн шт. Сокращение производства связано с запретом западных стран на поставки в Россию компонентов, софта и оборудования, необходимых для изготовления процессоров и контроллеров, а также с ужесточением государством требований по локализации, к которым оказались не готовы многие игроки рынка электроники и вычислительной техники.