

According to BusinesStat, Moscow and Saint-Petersburg were the leaders by turnover of the healthcare market, 217 and 62.6 billion rubles respectively. Values of the healthcare markets of other millionaire cities were between 5.5-15.4 billion rubles. Patients with income below 30 thousand rubles contribute the most to the profit of healthcare institutions in all big Russian cities except for Moscow. Salaries of the major part of citizens of millionaire cities are below 30 thousand rubles.
Value of the healthcare market of millionaire cities is growing fast, on average by 13.2% annually. The main factor determining the growth is rising prices for healthcare services. In 2012, the highest prices were registered in Moscow and Saint-Petersburg, 889.9 and 806.7 rubles per appointment respectively.
By the end of 2012, there were 29.2 healthcare facilities registered in Russia, a fourth of them were located in cities with the population over 1 million people. The majority of healthcare institutions in 2012 were in Moscow, Saint-Petersburg and Ekaterinburg, 1,746, 771 and 472 facilities respectively; they are different by profile, number of workers and number of patients served.
In 2013-2017, the number of healthcare facilities in millionaire cities will be dropping slowly. This decline will be connected with gradual consolidation of the market and extension of clinics.
The 2008-2017 Outlook for the Healthcare Services in Millionaire Cities of Russia contains the essential data, necessary to comprehend the current market opportunities and to assess the future prospects of development in the market. The outlook introduces statistics of medical facilities and personnel, patients, appointments, costs of appointment, the volume and value of the market, financial and investment activities of the industry.
The outlook contains the following specifications:
Along with the outlook of the healthcare market of millionaire cities of Russia, BusinesStat offers outlooks of the healthcare markets of all big cities of Russia.
Official statistics and the company`s database were used for preparing the outlook.
The main source of information for the outlook is the unique BusinesStat research:
Additional sources of information for the outlook are the data on the core public organs and scientific and research organizations:
NUMBER OF HEALTHCARE FACILITIES
CONSUMERS OF HEALTHCARE SERVICES
NUMBER OF APPOINTMENTS RENDERED
VALUE OF THE MARKET OF HEALTHCARE SERVICES
AVERAGE COST OF MEDICAL APPOINTMENTS
AVERAGE ANNUAL EXPENSES ON ATTENDING TO A PATIENT
PATIENTS BY INCOME LEVEL
The report contains 55 table
Table 1. Number of healthcare facilities in millionaire cities, 2008-2012 (units)
Table 2. Forecast of the number of healthcare facilities in millionaire cities, 2013-2017 (units)
Table 3. Number of consumers of healthcare services in millionaire cities, 2008-2012 (thousand people)
Table 4. Forecast of the number of consumers of healthcare services in millionaire cities, 2013-2017 (thousand people)
Table 5. Number of consumers of OMI in millionaire cities, 2008-2012 (thousand people)
Table 6. Forecast of the number of consumers OMI in millionaire cities, 2013-2017 (thousand people)
Table 7. Number of consumers of legal commercial healthcare in millionaire cities, 2008-2012 (thousand people)
Table 8. Forecast of the number of consumers of legal commercial healthcare in millionaire cities, 2013-2017 (thousand people)
Table 9. Number of consumers of VMI in millionaire cities, 2008-2012 (thousand people)
Table 10. Forecast of the number of consumers of VMI in millionaire cities, 2013-2017 (thousand people)
Table 11. Number of consumers of shadow healthcare in millionaire cities, 2008-2012 (thousand people)
Table 12. Forecast of the number of consumers of shadow healthcare in millionaire cities, 2013-2017 (thousand people)
Table 13. Number of appointments rendered in millionaire cities, 2008-2012 (million appointments)
Table 14. Forecast of the number of appointments rendered in millionaire cities, 2013-2017 (million appointments)
Table 15. Number of medical appointments rendered in the sector of OMI in millionaire cities, 2008-2012 (million)
Table 16. Forecast of the number of medical appointments rendered in the sector of OMI, 2013-2017 (million)
Table 17. Number of medical appointments rendered in the sector of legal commercial healthcare in millionaire cities, 2008-2012 (million)
Table 18. Forecast of the number of medical appointments rendered in the sector of legal commercial healthcare in millionaire cities, 2013-2017 (million)
Table 19. Number of medical appointments rendered under VMI in millionaire cities, 2008-2012 (million)
Table 20. Forecast of the number of medical appointments rendered under VMI in millionaire cities, 2013-2017 (million)
Table 21. Number of shadow appointments rendered in millionaire cities, 2008-2012 (million)
Table 22. Forecast of the number of shadow appointments rendered in millionaire cities, 2013-2017 (million)
rubles)
Table 23. Value of the healthcare market in millionaire cities, 2008-2012 (billion rubles)
Table 24. Forecast of the value of the healthcare market in millionaire cities, 2013-2017 (billion
Table 25. Value of the OMI sector in millionaire cities, 2008-2012 (billion rubles)
Table 26. Forecast of the value of the OMI sector in millionaire cities, 2013-2017 (billion rubles)
Table 27. Value of legal commercial healthcare in millionaire cities, 2008-2012 (billion rubles)
Table 28. Forecast of the value of legal commercial healthcare in millionaire cities, 2013-2017 (billion rubles)
Table 29. Value of the VMI sector in millionaire cities, 2008-2012 (billion rubles)
Table 30. Forecast of the value of the VMI sector in millionaire cities, 2013-2017 (billion rubles)
Table 31. Value of the shadow healthcare sector in millionaire cities, 2008-2012 (billion rubles)
Table 32. Forecast of the value of the shadow healthcare sector in millionaire cities, 2013-2017 (billion rubles)
Table 33. Average cost of medical appointments rendered in millionaire cities, 2008-2012 (rubles per appointment)
Table 34. Forecast of the average cost of medical appointments rendered in millionaire cities, 2013-2017 (rubles per appointment)
Table 35. Average cost of appointment in the OMI sector in millionaire cities, 2008-2012 (rubles per appointment)
Table 36. Forecast of the average cost of service in the sector of OMI in millionaire cities, 2013-2017 (rubles per appointment)
Table 37. Average cost of appointment in legal commercial healthcare in millionaire cities, 2008-2012 (rubles per appointment)
Table 38. Forecast of the average cost of appointment in legal commercial healthcare in millionaire cities, 2013-2017 (rubles per appointment)
Table 39. Average price for an appointment under VMI in millionaire cities, 2008-2012 (rubles per appointment)
Table 40. Forecast of the average price for an appointment under VMI in millionaire cities, 2013-2017 (rubles per appointment)
Table 41. Average cost of an appointment in the sector of shadow healthcare in millionaire cities, 2008-2012 (rubles per appointment)
Table 42. Forecast of an average cost of an appointment in the sector of shadow healthcare in millionaire cities, 2013-2017 (rubles per appointment)
Table 43. Average annual expenses on attending to a patient in millionaire cities, 2008-2012 (thousand rubles)
Table 44. Forecast of average annual expenses on attending to a patient in millionaire cities, 2013-2017 (thousand rubles)
Table 45. Average annual expenses per patient in the sector of OMI in millionaire cities, 2008-2012 (thousand rubles)
Table 46. Forecast of the average annual expenses per patient in the sector of OMI in millionaire cities, 2013-2017 (thousand rubles)
Table 47. Average annual expenses per patient in the sector of legal commercial healthcare in millionaire cities, 2008-2012 (thousand rubles)
Table 48. Forecast of the average annual expenses per patient in the sector of legal commercial healthcare in millionaire cities, 2013-2017 (thousand rubles)
Table 49. Average annual expenses per patient in the sector of VMI in millionaire cities, 2008-2012(thousand rubles)
Table 50. Forecast of the average annual expenses per patient in the sector of VMI in millionaire cities, 2013-2017 (thousand rubles)
Table 51. Average annual expenses per patient in the sector of shadow healthcare in millionaire cities, 2008-2012 (thousand rubles)
Table 52. Forecast of the average annual expenses per patient in the sector of shadow healthcare in millionaire cities, 2013-2017 (thousand rubles)
Table 53. Number of patients by income level in millionaire cities, 2012 (thousand people)
Table 54. Value of the healthcare market by income group in millionaire cities, 2012 (million rubles)
Table 55. Average annual expenses per patient by income group in millionaire cities, 2012 (thousand rubles)
 Анализ рынка медицинских услуг в Узбекистане в 2018-2022 гг, прогноз на 2023-2027 гг
BusinesStat
100 000 ₽
 Анализ рынка медицинских услуг в Татарстане в 2018-2022 гг, прогноз на 2023-2027 гг
BusinesStat
100 000 ₽
 Готовый бизнес-план медицинского центра со стационаром и оперблоком
ЭКЦ "ИнвестПроект"
54 900 ₽
 Бизнес-план медицинской лаборатории по франшизе "Гемотест" (с финансовой моделью)
ЭКЦ "ИнвестПроект"
26 900 ₽

 Статья, 19 апреля 2024
BusinesStat
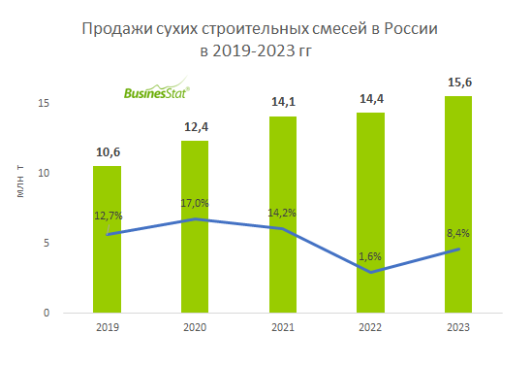
В 2023 г продажи сухих строительных смесей в России выросли на 8,4% и составили 15,6 млн т.
Замедлился рост цен на сухие смеси за счет оптимизации логистики и постепенного замещения дефицитных импортных компонентов.
По данным «Анализа рынка сухих строительных смесей в России», подготовленного BusinesStat в 2024 г, в 2023 г их родажи в стране выросли на 8,4% и составили 15,6 млн т.
 Статья, 19 апреля 2024
BusinesStat
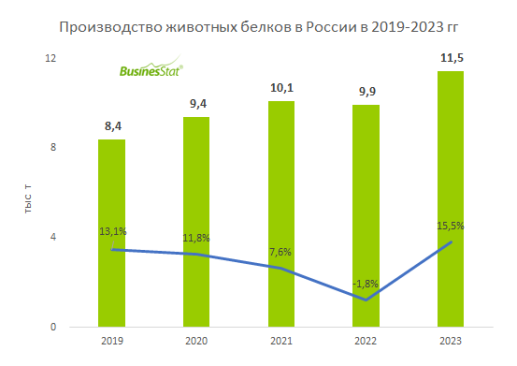
В 2023 г производство животных белков в России выросло на 15,5% и составило 11,5 тыс т.
Спрос на животный белок растет благодаря увеличению производства колбасных изделий.
По данным «Анализа рынка животных белков в России», подготовленного BusinesStat в 2024 г, в 2023 г их производство в стране выросло на 15,5% и составило 11,5 тыс т.
 Статья, 18 апреля 2024
AnalyticResearchGroup (ARG)
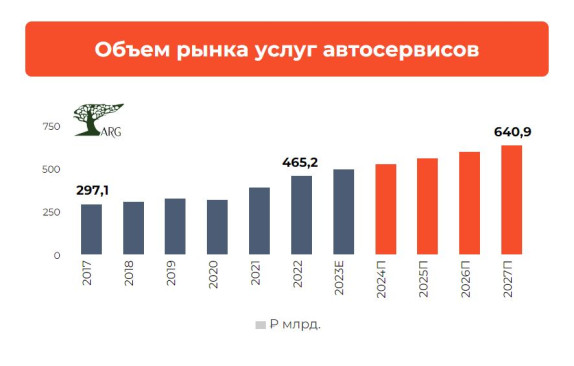
Объем рынка автосервисов в России в 2027 году может составить почти ₽650 млрд.
Росту рынка способствуют проблемы с поставками запчастей, устаревание парка автомобилей и повышение цен.
В 2022 году общая сумма услуг, предоставленных автосервисами населению в России, оценивалась в 465,2 миллиарда рублей, что на 17,9% превышает уровень предыдущего года. Показатель CAGR на этом рынке за период с 1994 года составил 27,5%.