

In 2008-2012, the sales volume of bread and bakery products in Russia lowered by 7% and totaled about 9 million tons in 2012. Ths index was lowering annually against the previous years..
In 2008-2012, retail trade accounted for the biggest share in the sales volume. Its share was between 88% in 2008 and 86% in 2012. The HoReC sector held the other 13% of the sales volume.
According to BusinesStat, in 2008-2012, products of wheat flour accounted for the biggest share in the sales volume of bread and bakery products, about 48%. The share of bakery products of rye-and-wheat flour was significantly less, 28% of the market. Consumer preferences are constanly changing. Cosumers are showing more interest in products with high added value such as rich bread, baguettes and bread with different additives (bran, flax seeds, oat flakes and so on) while demand for traditional sorts of bread is falling fast. For instance, in 2008, the share of bakery producst of rye flour in the total volume of bread sales in Russia amounted to almost 6%, and in 2012 their share dropped to 3%. The situation in the market of rich bakery products is just the opposite, their share in sales rose from 4% to 5% during the same period. The market of prepared bakery products was developing quite actively; its share went up from 0.4% to 0.8% in 2012.
The 2008-2017 Outlook for the Bread and Bakery Product Market in Russia contains the essential data, necessary to comprehend the current market opportunities and conditions and to assess the future prospects, covering such points as:
The report contains detailed information on types of bread and bakery products:
The information is detailed by market sector:
The outlook contains separate chapters on producers of bread and bakery products:
Khlebny Dom, Karavai, Lipetskkhlebmakaronprom, Pervy Bakery Plant Chelyabinsk, Bakery Plant №22, Vladimir Bakery Plant, Volzhsky Pekar, Peko Bakery Plant, Cherkizovo, Yug Rusi Bakery Plant, Schelkovokhleb, Kolos, Zvezdny, Pokrovsky Khleb, Proletarets Bakery Plant, Kazan Bakery Plant №3, KBK Cheremushki, Chelni-Khleb, Kurskkhleb, Moskvorechie, etc.
BusinesStat prepares outlooks for the global market of bread and bakery products and for the CIS markets, EU and separate countries.
The outlook contains detailed information by region of the country.
The ratings of the biggest importers and exports of bread and bakery products are presented.
Detailed information by region is given in the outlook for Russia. The outlook contains information on the major producers of metal works
The survey is based on the official statistics, obtained from:
The results of BusinesStat research were applied along with official statistics:
CONDITION OF THE RUSSIAN ECONOMY
CLASSISICATION OF BREAD AND BAKERY PRODUCTS
DEMAND FOR AND SUPPLY OF BREAD AND BAKERY PRODUCTS
SALES OF BREAD AND BAKERY PRODUCTS
SALES OF BREAD AND BAKERY PRODUCTS FOR THE HORECA SECTOR
RETAIL TRADE
MARKET CAPACITY OF BREAD AND BAKERY PRODUCTS
OUTPUT OF BREAD AND BAKERY PRODUCTS
MANUFACTURERS AND SUPPLIERS OF BREAD AND BAKERY PRODUCTS
EXPORT AND IMPORT OF BREAD AND BAKERY PRODUCTS
ECONOMIC INDICES OF THE INDUSTRY «PRODUCTION OF BREAD AND WAD OF SHORT-TERM STORAGE»
ECONOMIC INDICES OF THE INDISTRY «PRODUCTION OF DRY BREAD PRODUCTS AND WAD OF LONG-TERM STORAGE»
PROFILES OF THE LEADING MANUFATCURERS OF BREAD AND BAKERY PRODUCTS
The report contains 148 table
Table 1. Nominal and real GDP volumes, Russia, 2008-2017 (trillion rubles)
Table 2. Real GDP volume and its index, Russia, 2008-2017 (trillion rubles, %)
Table 3. Fixed investments from all sources of financing, Russia, 2008-2017 (trillion rubles, %)
Table 4. Export and import volumes and balance of trade, Russia, 2008-2017 (billion dollars)
Table 5. Average annual exchange rate of the US dollar to the ruble, Russia, 2008-2017 (RUR/USD, %)
Table 6. Consumer price index (the inflation rate) and producer price index, Russia, 2008-2017 (% to the previous year)
Table 7. Size of population inclusive of migrants, Russia, 2008-2017 (million people)
Table 8. Real household income, Russia, 2008-2017 (% to the previous year)
Table 9. Volume of supply of bread and bakery products, Russia, 2008-2012 (thousand tons; %)
Table 10. Forecast of the supply volume of bread and bakery products, Russia, 2013-2017 (thousand tons; %)
Table 11. Production, import and in-stock balance of bread and bakery products, Russia, 2008-2012 (thousand tons)
Table 12. Forecast of production, import and in-stock balance of bread and bakery products, Russia, 2013-2017 (thousand tons)
Table 13. Volume of demand for bread and bakery products, Russia, 2008-2012 (thousand tons; %)
Table 14. Forecast of the volume of demand for bread and bakery products, Russia, 2013-2017 (thousand tons; %)
Table 15. Volume of sales and export of bread and bakery products, Russia, 2008-2012 (thousand tons)
Table 16. Forecats of the volume of sales and export of bread and bakery products, Russia, 2013-2017 (thousand tons)
Table 17. Balance of demand for and supply of bread and bakery products including the in-stock balance at the end of the year, Russia, 2008-2012 (thousand tons; %)
Table 18. Forecast of the balance of demand for and supply of bread and bakery products including the in-stock balance at the end of the year, Russia, 2013-2017 (thousand tons; %)
Table 19. Sales volume of bread and bakery products, Russia, 2008-2012 (thousand tons; %)
Table 20. Forecast of the sales volume of of bread and bakery products, Russia, 2013-2017 (thousand tons; %)
Table 21. Sales volume of bread and bakery products by sector, Russia, 2008-2012 (thousand tons)
Table 22. Forecast of the sales volume of bread and bakery products by sector, Russia, 2013-2017 (thousand tons)
Table 23. Sales volume of bread and bakery products by type, Russia, 2008-2012 (thousand tons)
Table 24. Forecast of the sales volume of bread and bakery products by type, Russia, 2013-2017 (thousand tons)
Table 25. Sales value of bread and bakery products, Russia, 2008-2012 (billion RUR; %)
Table 26. Forecast of the sales value of bread and bakery products, Russia, 2013-2017 (billion RUR; %)
Table 27. Sales value of bread and bakery products by sector, Russia, 2008-2012 (billion RUR)
Table 28. Forecats of the sales value of bread and bakery products by sector, Russia, 2013-2017 (billion RUR)
Table 29. Sales value of bread and bakery products by type, Russia, (billion RUR)
Table 30. Forecast of the sales value of bread and bakery products by type, Russia, 2013-2017 (billion RUR)
Table 31. Average price for bread and bakery products, Russia, 2008-2012 (RUR per kg; %)
Table 32. Forecast of the average price for bread and bakery products, Russia, 2013-2017 (RUR per kg; %)
Table 33. Average price for bread and bakery products by sector, Russia, 2008-2012 (RUR per kg)
Table 34. Forecast of the average price for bread and bakery products by sector, Russia, 2013-2017 (RUR per kg)
Table 35. Average price for bread and bakery products by type, Russia, 2008-2012 (RUR per kg)
Table 36. Forecast of the average price for bread and bakery products by type, Russia, 2013-2017 (RUR per kg)
Table 37. Correlation between the average price for bread and bakery products and the inflation rate, Russia, 2008-2012 (%)
Table 38. Forecast of the correlation between the average price for bread and bakery products and the inflation rate, Russia, 2013-2017 (%)
Table 39 Correlation between the volume of sales, value of sales and average wholesale price for bread and bakery products, Russia, 2008-2012 (thousand tons; RUR per kg; million RUR)
Table 40. Forecast of correlation between the volume of sales, value of sales and average wholesale price for bread and bakery products, Russia, 2013-2017 (thousand tons; RUR per kg; million RUR)
Table 41. Volume of sales of bread and bakery products for the HoReCa sector, Russia, 2008-2012 (thousand tons; %)
Table 42. Forecast of the sales volume of bread and bakery products for the HoReCa sector, Russia, 2013-2017 (thousand tons; %)
Table 43. Value of sales of bread and bakery products for the HoReCa sector, Russia, 2008-2012 (billion RUR)
Table 44. Forecast of the sales value of bread and bakery products for the HoReCa sector, Russia, 2013-2017 (billion RUR)
Table 45. Average price for bread and bakery products for the HoReCa sector, Russia, 2008-2012 (RUR per kg; %)
Table 46. Forecast of the average price for bread and bakery products for the HoReCa sector, Russia, 2013-2017 (RUR per kg; %)
Table 47. Volume of retail sales of bread and bakery products, Russia, 2008-2012 (thousand tons; %)
Table 48. Forecast of the retail sales volume of bread and bakery products, Russia, 2013-2017 (thousand tons; %)
Table 49. Volume of retail sales of bread and bakery products by region, Russia, 2008-2012
(thousand tons)
Table 50. Value of retail sales of bread and bakery products, Russia, 2008-2012 (billion RUR; %)
Table 51. Forecast of the value of retail sales of bread and bakery products, Russia, 2013-2017 (billion RUR; %)
Table 52. Value of retail sales of bread and bakery products by region, Russia, 2008-2012 (million RUR)
Table 53. Retail price for bread and bakery products, Russia, 2008-2012 (RUR per kg; %)
Table 54. Forecast of the retail price for bread and bakery products, Russia, 2013-2017 (RUR per kg; %)
Table 55. Retail price for bread and bakery products by region, Russia, 2008-2012 (RUR per kg)
Table 56. Number of consumers of bread and bakery products, Russia, 2008-2012 (million people)
Table 57. Forecast of the number of buyers of bread and bakery products, Russia, 2013-2017 (million people)
Table 58. Share of buyers of bread and bakery products in the size of population, Russia, 2008-2012
(%)
Russia, 2013-2017 (%)
Table 59. Forecast of the share of buyers of bread and bakery products in the size of population,
Table 60. Purchase volume and average expenses on bread and bakery products, Russia, 2008-2012
(kg per year; thousand RUR per year)
Table 61. Forecast of the purchase volume and average expenses on bread and bakery products,
Russia, 2013-2017 (kg per year; thousand RUR per year)
Table 62. Volume and capacity of the market of bread and bakery products, Russia, 2008-2012 (thousand tons)
Table 63. Forecast of the volume and capacity of the market of bread and bakery products, Russia, 2013-2017 (thousand tons)
Table 64. Saturation of the market of bread and bakery products, Russia, 2008-2012 (thousand tons, %)
Table 65. Forecast of market saturation of bread and bakery products, Russia, 2013-2017 (thousand tons, %)
Table 66. Number of consumers of bread and bakery products, Russia, 2008-2012 (million people; %)
Table 67. Forecast of the number of consumers of bread and bakery products, Russia, 2013-2017 (million people; %)
Table 68. Share of consumers of bread and bakery products in the size of population of Russia, 2008-2012 (%)
Table 69. Forecast of the number of consumers of bread and bakery products in the size of population of Russia, 2013-2017 (%)
Table 70. Consumption level of bread and bakery products, Russia, 2008-2012 (kg per year; %)
Table 71. Forecast of the consumption level of bread and bakery products, Russia, 2013-2017 (kg per year; %)
Table 72. Production volume of bread and bakery products, Russia, 2008-2012 (thousand tons, %)
Table 73. Forecast of the production volume of bread and bakery products, Russia, 2013-2017 (thousand tons, %)
Table 74. Shares of registered and unregistered production volumes of bread and bakery products, Russia, 2008-2012 (thousand tons; %)
Table 75. Forecats of the shares of registered and unregistered production volumes of bread and bakery products, Russia, 2012-2016 (thousand tons; %)
Table 76. Production volume of bread and bakery products by type, Russia, 2008-2012 (thousand tons)
Table 77. Forecast of the production volume of bread and bakery products by type, Russia, 2013-2017 (thousand tons)
Table 78. Production volume of bread and bakery products by region, Russia, 2008-2012 (thousand tons)
Table 79. Average annual capacity of plants producing bread and bakery products, Russia, 2008-2012 (thousand tons)
Table 80. Forecast of the average annual capacity of plants producing bread and bakery products, Russia, 2013-2017 (thousand tons)
Table 81. Use of average annual plant capacity for producing bread and bakery products, Russia, 2008-2012 (%)
Table 82. Forecast of the use of average annual plant capacity for producing bread and bakery products, Russia, 2013-2017 (%)
Table 83. Producer price for bread and bakery products, Russia, 2008-2012 (RUR per kg, %)
Table 84. Forecast of the producer price for bread and bakery products, Russia, 2013-2017 (RUR per kg, %)
Table 85. Producer price of bread and bakery products by type, Russia, 2008-2012 (RUR per kg)
Table 86. Forecast of the producer price of bread and bakery products by type, Russia, 2013-2017
Table 87. Rating of companies, producing bread and bakery products, by production volume, Russia, 2011 (tons)
Table 88. Rating of companies, producing bread and bakery products, by sales revenue, Russia,
2011 (million RUR)
Table 89. Rating of companies, producing bread and bakery products, by gross profit on sales,
Russia, 2011 (million RUR)
Table 90. Rating of companies, producing bread and bakery products, by profit margin, Russia,
2011 (%)
Table 91. Rating of companies, importing bread and bakery products, by import volume, Russia, 2012 (tons)
Table 92. Rating of companies, importing bread and bakery products, by import value, Russia, 2012 (thousand USD)
Table 93. Rating of companies, exporting bread and bakery products, by export volume, Russia, 2012 (tons)
Table 94. Rating of companies, exporting bread and bakery products, by export value, Russia, 2012 (thousand USD)
Table 95. Rating of Russian companies, receiving imported bread and bakery products, by shipment volume, Russia, 2012 (tons)
Table 96. Rating of Russian companies, receiving imported bread and bakery products, by shipment value, Russia, 2012 (thousand USD)
Table 97. Balance of export and import of bread and bakery products, Russia, 2008-2012 (thousand tons)
Table 98. Forecast of the balance of export and import of bread and bakery products, Russia, 2013-2017 (thousand tons)
Table 99. Export volume of bread and bakery products, Russia, 2008-2012 (thousand tons, %)
Table 100. Forecast of the export volume of bread and bakery products, Russia, 2013-2017 (thousand tons, %)
Table 101. Export volume of bread and bakery products by type, Russia, 2008-2012 (tons)
Table 102. Forecast of the export volume of bread and bakery products by type, Russia, 2013-2017 (tons)
Table 103. Export volume of bread and bakery products by country, Russia, 2008-2012 (tons)
Table 104. Export value of bread and bakery products, Russia, 2008-2012 (million USD, %)
Table 105. Forecast of the export value of bread and bakery products, Russia, 2013-2017 (million USD, %)
Table 106. Export value of bread and bakery products, Russia, 2008-2012 (thousand dollars)
Table 107. Forecast of the export value of bread and bakery products, Russia, 2013-2017 (thousand dollars)
Table 108. Export value of bread and bakery products by country, Russia, 2008-2012 (thousand dollars)
Table 109. Export price for bread and bakery products, Russia, 2008-2012 (USD per kg, %)
Table 110. Forecast of the export price for bread and bakery products, Russia, 2013-2017 (USD per kg, %)
Table 111. Export price for bread and bakery products by type, Russia, 2008-2012 (USD per kg)
Table 112. Forecast of the export price for bread and bakery products by type, Russia, 2013-2017 (USD per kg)
Table 113. Export price for bread and bakery products by country, Russia, 2008-2012 (USD per kg)
Table 114. Import volume of bread and bakery products including shipments from Belarus to Russia, 2008-2012 (thousand tons)
Table 115. Forecast of the import volume of bread and bakery products including shipments from Belarus to Russia, 2013-2017 (thousand tons)
Table 116. Import volume of bread and bakery products, Russia, 2008-2012 (thousand tons, %)
Table 117. Forecast of the import volume of bread and bakery products, Russia, 2013-2017 (thousand tons, %)
Table 118. Import volume of bread and bakery products by type, Russia, 2008-2012 (thousand tons)
Table 119. Forecast of the import volume of bread and bakery products, Russia, 2013-2017 (thousand tons)
Table 120. Import volume of bread and bakery products by country, Russia, 2008-2012 (thousand tons)
Table 121. Import value of bread and bakery products including shipments from Belarus to Russia, 2008-2012 (million USD)
Table 122. Forecast of the import value of bread and bakery products including shipments from Belarus to Russia, 2013-2017 (million USD)
Table 123. Import value of bread and bakery products, Russia, 2008-2012 (million USD, %)
Table 124. Forecast of the import value of bread and bakery products, Russia, 2013-2017 (million USD, %)
Table 125. Import value of bread and bakery products by type, Russia, 2008-2012 (thousand dollars)
Table 126. Forecast of the import value of bread and bakery products by type, Russia, 2013-2017 (million USD)
Table 127. Import value of bread and bakery products by country, Russia, 2008-2012 (thousand dollars)
Table 128. Import price for bread and bakery products including shipments from Russia to Belarus, 2008-2012 (USD per kg)
Table 129. Forecats of the import price for bread and bakery products shipments from Russia to Belarus, 2013-2017 (USD per kg)
Table 130. Import price for bread and bakery products, Russia, 2008-2012 (USD per kg, %)
Table 131. Forecast of the import price for bread and bakery products, Russia, 2013-2017 (USD per kg, %)
Table 132. Import price for bread and bakery products by type, Russia, 2008-2012 (USD per kg)
Table 133. Forecast of the import price for bread and bakery products by type, Russia, 2013-2017 (USD per kg)
Table 134. Import price for bread and bakery products by country, Russia, 2008-2012 (USD per kg)
Table 136. Commercial and administrative expenses, Russia, 2008-2012 (billion RUR; %)
Table 137. Net cost, Russia, 2008-2012 (billion RUR; %)
Table 138. Gross profit on sales, Russia, 2008-2012 (billion RUR; %)
Table 135. Sales revenue (net), Russia, 2008-2012 (billion RUR; %)
Table 139. Economic efficiency of the industry, Russia, 2008-2012 (%; times; days)
Table 140. Investments in the industry, Russia, 2008-2012 (million RUR)
Table 141. Labour resources, Russia, 2008-2012 (thousand people; billion RUR; thousand RUR
per year)
Table 142. Sales revenue (net), Russia, 2008-2012 (billion RUR; %)
Table 143. Commercial and administrative expenses, Russia, 2008-2012 (billion RUR; %)
Table 144. Net cost, Russia, 2008-2012 (billion RUR; %)
Table 145. Gross profit on sales, Russia, 2008-2012 (billion RUR; %)
Table 146. Economic efficiency of the industry, Russia, 2007-2011 (%; times; days)
Table 147. Investments in the industry, Russia, 2008-2012 (million RUR)
Table 148. Labour resources of the indurtsy, Russia, 2008-2012 (thousand people; billion RUR;
thousand RUR per year)
 Анализ розничных цен на сдобные булки 2024: динамика в рознице и инфляция 2000 – февраль 2024. Россия, федеральные округа, регионы
Экспресс-Обзор
45 000 ₽
 Рынок ритейла в России: хлебобулочные и кондитерские изделия - 2023
AnalyticResearchGroup (ARG)
88 000 ₽
 Анализ рынка хлебобулочных и мучных кондитерских изделий в странах Африки/Аравийского полуострова - 2022 год
DISCOVERY Research Group
100 000 ₽
 Рынок хлеба и хлебобулочных изделий 2023: розничные продажи (статистика компаний) с 2017 по 1 полугодие 2023, срез по федеральным округам
Экспресс-Обзор
55 000 ₽

 Статья, 19 апреля 2024
BusinesStat
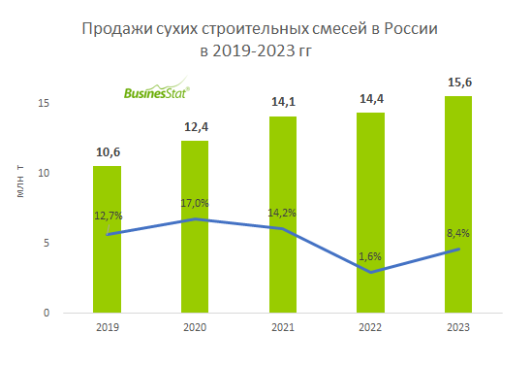
В 2023 г продажи сухих строительных смесей в России выросли на 8,4% и составили 15,6 млн т.
Замедлился рост цен на сухие смеси за счет оптимизации логистики и постепенного замещения дефицитных импортных компонентов.
По данным «Анализа рынка сухих строительных смесей в России», подготовленного BusinesStat в 2024 г, в 2023 г их родажи в стране выросли на 8,4% и составили 15,6 млн т.
 Статья, 19 апреля 2024
BusinesStat
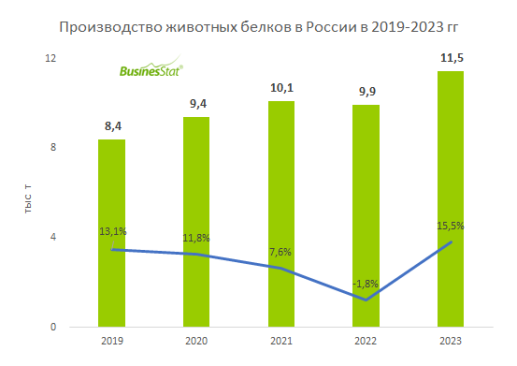
В 2023 г производство животных белков в России выросло на 15,5% и составило 11,5 тыс т.
Спрос на животный белок растет благодаря увеличению производства колбасных изделий.
По данным «Анализа рынка животных белков в России», подготовленного BusinesStat в 2024 г, в 2023 г их производство в стране выросло на 15,5% и составило 11,5 тыс т.
 Статья, 18 апреля 2024
AnalyticResearchGroup (ARG)
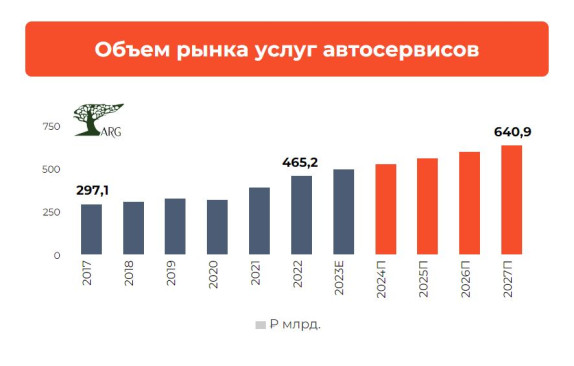
Объем рынка автосервисов в России в 2027 году может составить почти ₽650 млрд.
Росту рынка способствуют проблемы с поставками запчастей, устаревание парка автомобилей и повышение цен.
В 2022 году общая сумма услуг, предоставленных автосервисами населению в России, оценивалась в 465,2 миллиарда рублей, что на 17,9% превышает уровень предыдущего года. Показатель CAGR на этом рынке за период с 1994 года составил 27,5%.