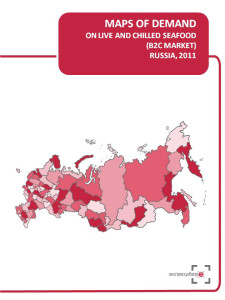
Map of demand on live and chilled seafood displays expenses per capita on purchased live and chilled seafood in rubles, $, €/RUB and market volume in amount of rub/$ in 2012.
Maps of demand by ‘Express-Obzor’ consist of 18 main slides (2 slides per each of 9 regional groups):
Map of demand on live and chilled seafood in Russia
Consumer expenses, $ per capita
Market Volume, $.
Map of demand on live and chilled seafood in Central FD
Consumer expenses, $ per capita
Market Volume, $.
Map of demand on live and chilled seafood in Northwest FD
Consumer expenses, $ per capita
Market Volume, $.
Map of demand on live and chilled seafood in Volga FD
Consumer expenses, $ per capita
Market Volume, $.
Map of demand on live and chilled seafood in Southern FD
Consumer expenses, $ per capita
Market Volume, $.
Map of demand on live and chilled seafood in North Caucasus FD
Consumer expenses, $ per capita
Market Volume, $.
Map of demand on live and chilled seafood in Urals FD
Consumer expenses, $ per capita
Market Volume, $.
Map of demand on live and chilled seafood in Siberian FD
Consumer expenses, $ per capita
Market Volume, $.
Map of demand on live and chilled seafood in Far East FD
Consumer expenses, $ per capita
Market Volume, $.
About the company
Company Express-Obzor since 2005 has been specializing in ready-made analytical market reports. Reports made my Express-Obzor’s specialists give an opportunity to receive basic information and a general idea of a market situation in a concise way. All assessments obtained in the course of a research are independent and impartial.
Over the past 8 years of activity the company:
- has gained a wide experience in analytical study and expert appraisal of various markets
- has published over 600 market surveys of nearly every economic sector
- has attended to more then 1000 clients